Fig. 2
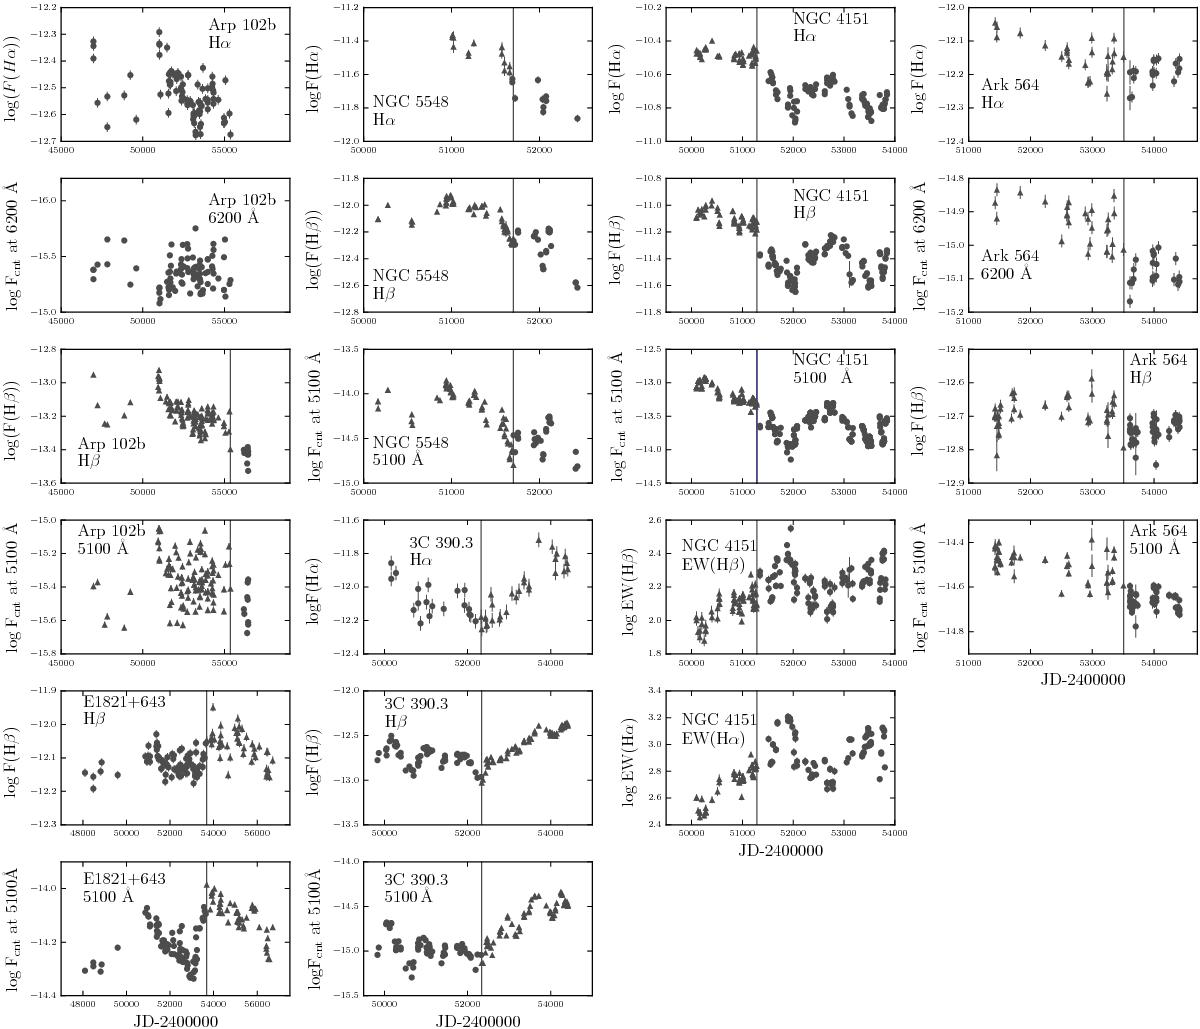
Light curves of the broad Hα and Hβ emission line fluxes, together with the continuum fluxes at 5100 Å and 6200 Å in logarithmic scale for the sample of six AGNs (object name and line/continuum denoted on each plot). Data are divided on the basis of the high-flux (triangles) and low-flux (full circles) states. Error bars are also shown, unless smaller than the marker.
Current usage metrics show cumulative count of Article Views (full-text article views including HTML views, PDF and ePub downloads, according to the available data) and Abstracts Views on Vision4Press platform.
Data correspond to usage on the plateform after 2015. The current usage metrics is available 48-96 hours after online publication and is updated daily on week days.
Initial download of the metrics may take a while.