Fig. 9
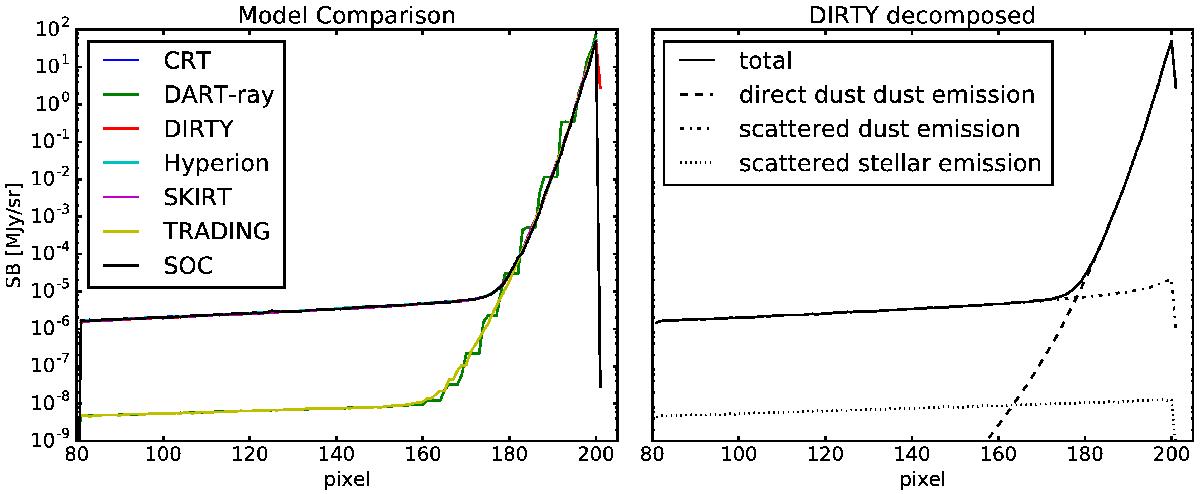
Contribution the scattered dust emission at λ = 35.11 μm makes to the Y slice for τz(1 μm) = 10, θ = 90° is shown. The comparison between all the code results is shown on the left, where the DART-ray and TRADING results are significantly below the results from the other five codes. On the right, the results from DIRTY are shown decomposed into the three contributing components. For the back three quarters of the slab, the scattered dust emission dominates over the direct dust emission and scattered stellar emission. The differences between DART-ray and TRADING and the rest of the codes is due to not calculating the scattered dust emisison component.
Current usage metrics show cumulative count of Article Views (full-text article views including HTML views, PDF and ePub downloads, according to the available data) and Abstracts Views on Vision4Press platform.
Data correspond to usage on the plateform after 2015. The current usage metrics is available 48-96 hours after online publication and is updated daily on week days.
Initial download of the metrics may take a while.