Fig. 7
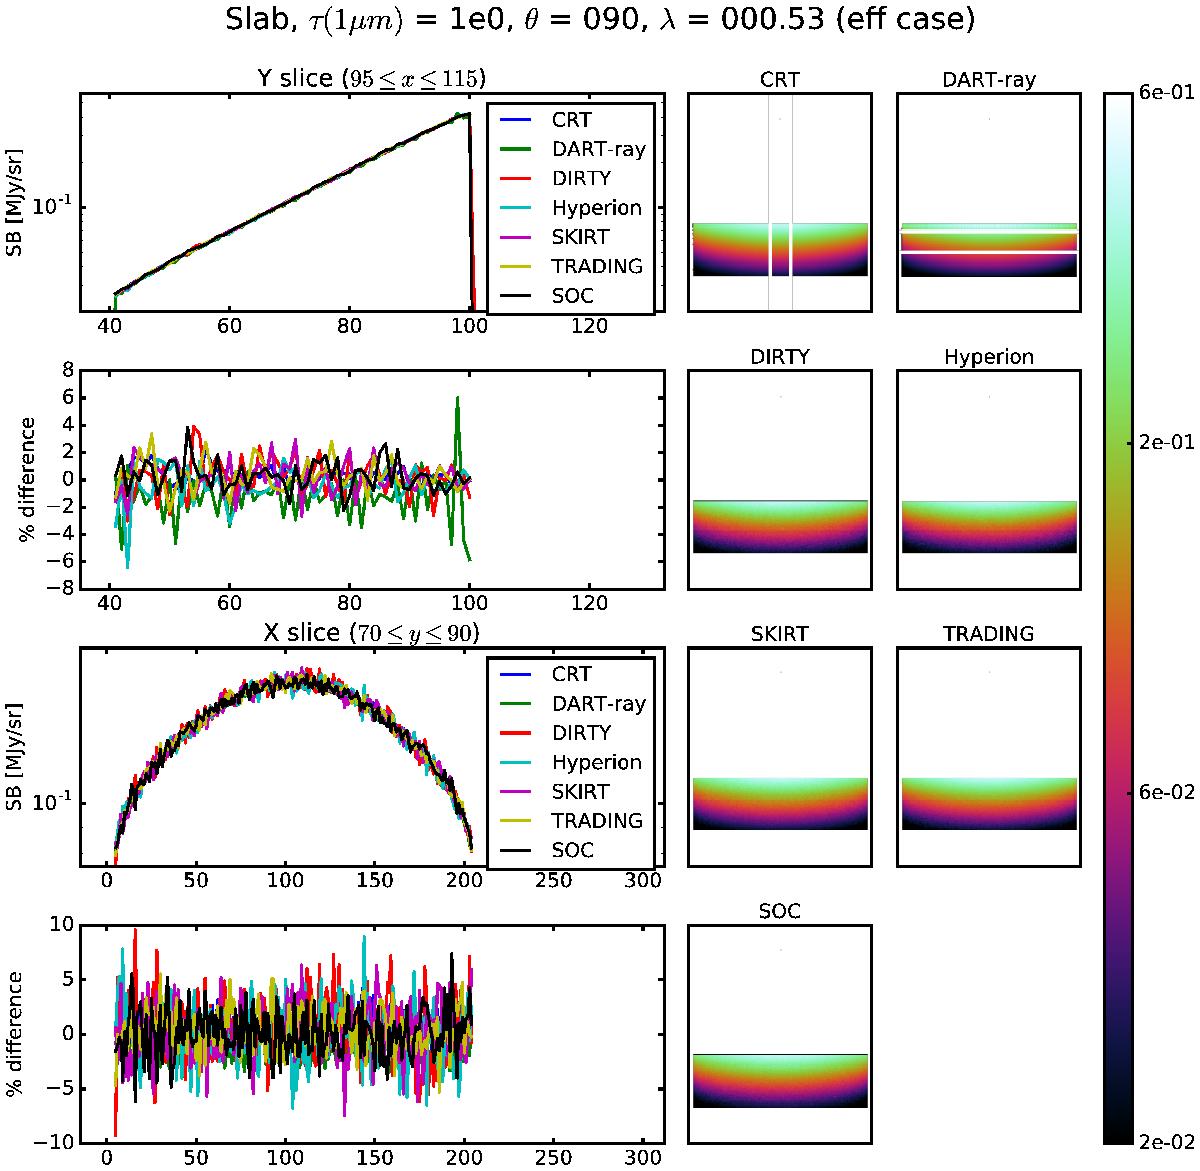
An example of the model image outputs is shown for the τz(1 μm) = 1 and effective grain case. In addition to the total images for each model, Y and X slices are shown along with the differences for each model from the median slice. The X and Y slices refer to the output image dimensions, not the axes in the 3D model space. The locations of each slice are shown over-plotted on the 1st (Y-slice) and 2nd (X-slice) model images where the slice is computed as an average over the slice width.
Current usage metrics show cumulative count of Article Views (full-text article views including HTML views, PDF and ePub downloads, according to the available data) and Abstracts Views on Vision4Press platform.
Data correspond to usage on the plateform after 2015. The current usage metrics is available 48-96 hours after online publication and is updated daily on week days.
Initial download of the metrics may take a while.