Fig. 6
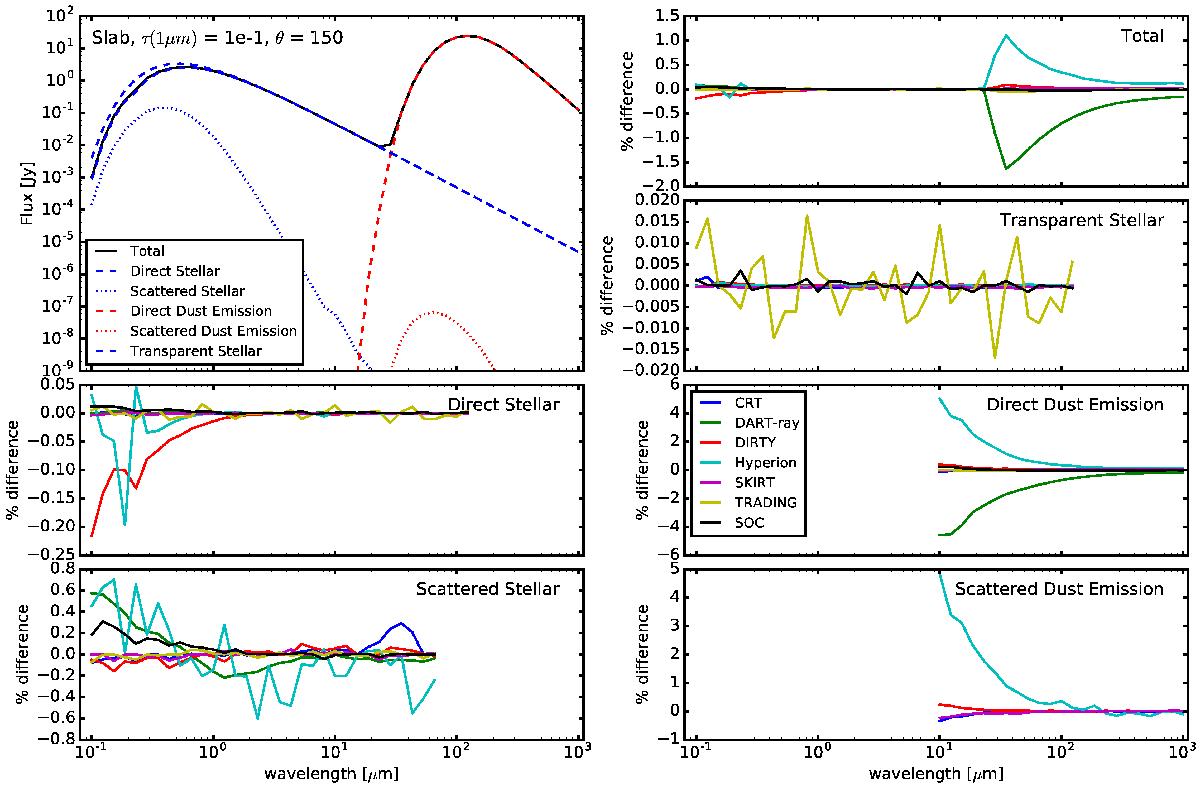
An example of the model global SED outputs are shown for the τz(1 μm) = 0.1, θ = 150°, and effective grain case. The plot in the upper left corner gives the median SED from all the models, both as a total and decomposed into components. The other plots give the percentage differences from the median for each of the components.
Current usage metrics show cumulative count of Article Views (full-text article views including HTML views, PDF and ePub downloads, according to the available data) and Abstracts Views on Vision4Press platform.
Data correspond to usage on the plateform after 2015. The current usage metrics is available 48-96 hours after online publication and is updated daily on week days.
Initial download of the metrics may take a while.