Fig. 15
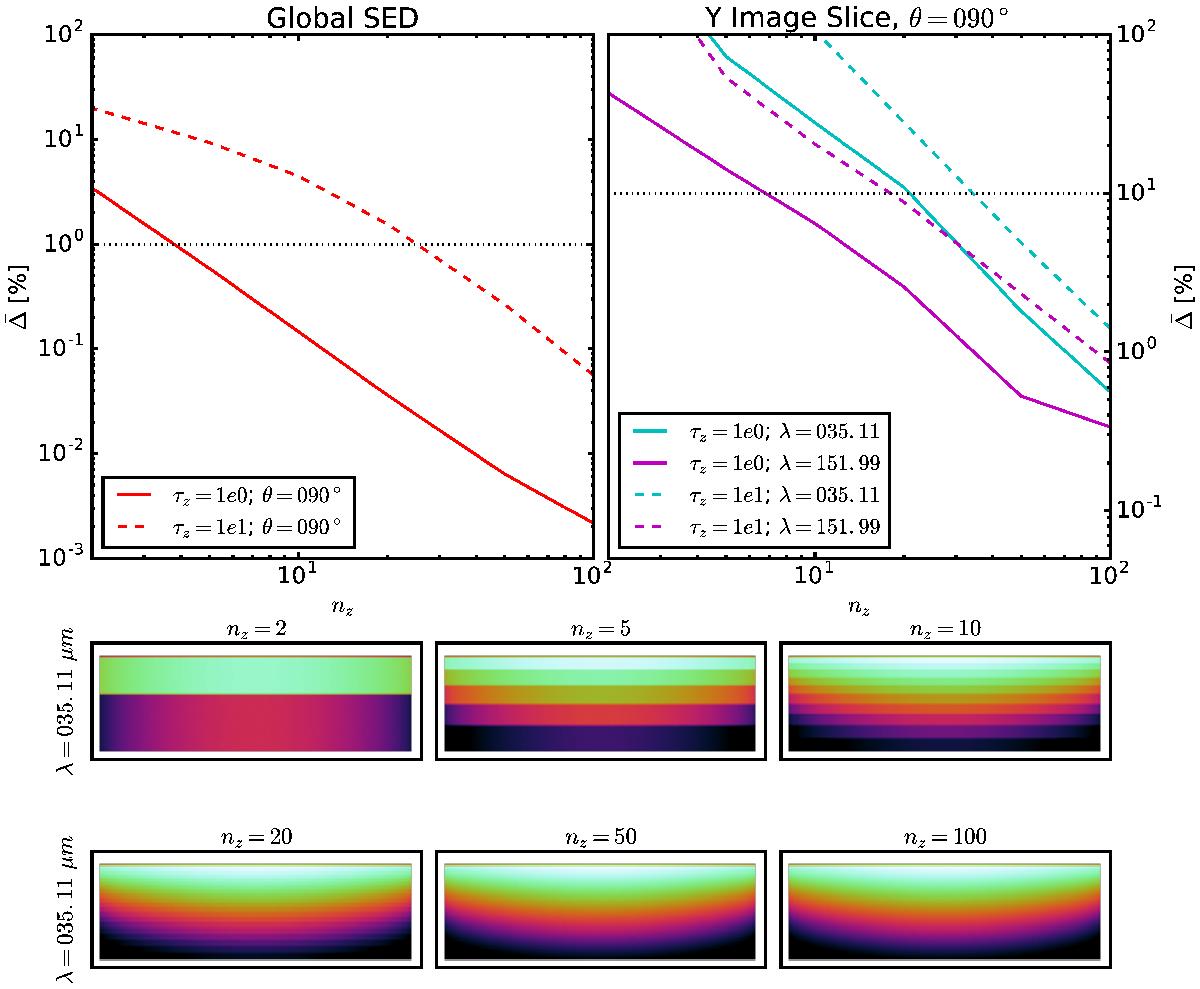
Average deviations (![]() ) versus nz are shown for the total global SEDs and Y image slices for τz(1 μm) = 1 and 10 and θ = 90°. The images are for the τz(1 μm) = 1 and θ = 90° case and illustrate the qualitative impact of increasing nz. The images are log scaled over the same range. The DIRTY spatial grid uses a log spacing along the z axis and this is reflected in the images shown. Only the image slices at two diagnostic infrared wavelengths probing the dust emission are shown as the ultraviolet and optical scattered light images are not sensitive to nz for Monte Carlo codes. The dashed and dotted horizontal lines give the 1% (global SED) and 10% (Y slice) lines. The results for nz = 200 are not shown as
) versus nz are shown for the total global SEDs and Y image slices for τz(1 μm) = 1 and 10 and θ = 90°. The images are for the τz(1 μm) = 1 and θ = 90° case and illustrate the qualitative impact of increasing nz. The images are log scaled over the same range. The DIRTY spatial grid uses a log spacing along the z axis and this is reflected in the images shown. Only the image slices at two diagnostic infrared wavelengths probing the dust emission are shown as the ultraviolet and optical scattered light images are not sensitive to nz for Monte Carlo codes. The dashed and dotted horizontal lines give the 1% (global SED) and 10% (Y slice) lines. The results for nz = 200 are not shown as ![]() is computed relative to this case where
is computed relative to this case where ![]() by definition.
by definition.
Current usage metrics show cumulative count of Article Views (full-text article views including HTML views, PDF and ePub downloads, according to the available data) and Abstracts Views on Vision4Press platform.
Data correspond to usage on the plateform after 2015. The current usage metrics is available 48-96 hours after online publication and is updated daily on week days.
Initial download of the metrics may take a while.