Fig. 13
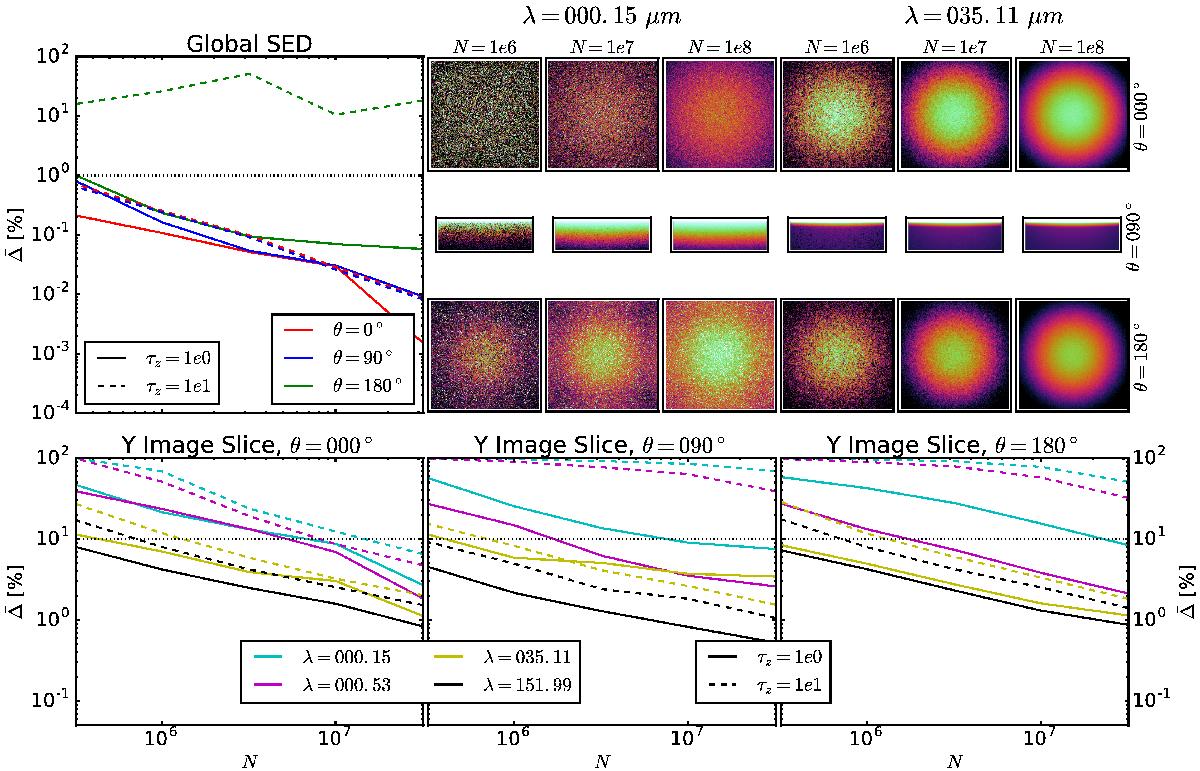
Average deviations (![]() ) versus the number of photons or rays that are computed at each wavelength (N) are shown for the total global SEDs and Y image slices. The images are for the most challenging case of τz(1 μm) = 10 and illustrate the qualitative impact of increasing N. Plots and images are shown for θ = 0°, 90°, and 180°. The dotted horizontal lines give the 1% (global SED) and 10% (Y slices) levels. The images are plotted with the same log scaling for each wavelength and angle combination. The results for N = 108 are not shown as
) versus the number of photons or rays that are computed at each wavelength (N) are shown for the total global SEDs and Y image slices. The images are for the most challenging case of τz(1 μm) = 10 and illustrate the qualitative impact of increasing N. Plots and images are shown for θ = 0°, 90°, and 180°. The dotted horizontal lines give the 1% (global SED) and 10% (Y slices) levels. The images are plotted with the same log scaling for each wavelength and angle combination. The results for N = 108 are not shown as ![]() is computed relative to this case where
is computed relative to this case where ![]() by definition.
by definition.
Current usage metrics show cumulative count of Article Views (full-text article views including HTML views, PDF and ePub downloads, according to the available data) and Abstracts Views on Vision4Press platform.
Data correspond to usage on the plateform after 2015. The current usage metrics is available 48-96 hours after online publication and is updated daily on week days.
Initial download of the metrics may take a while.