Fig. 10
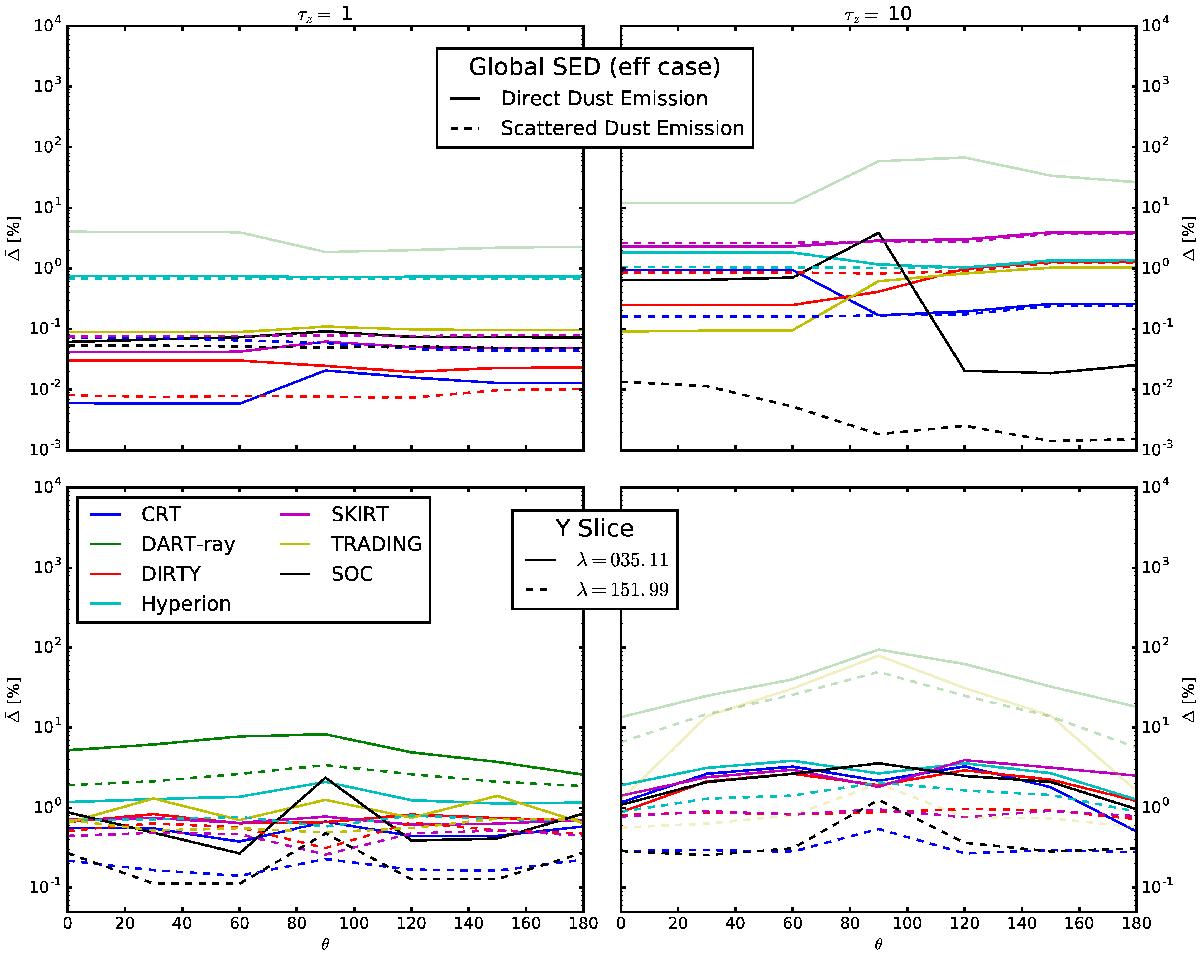
Average deviation from the median results are shown versus θ for the direct and scattered dust emission for the effective grain approximation in the top row. The Y slice average deviation from the median results are shown versus θ for two IR wavelengths probing the dust emission in the bottom row. The results for τz(1 μm) = 0.1 and 0.01 are similar to those for τz(1 μm) = 1.0. Models not used in the precision calculation are shown as faint lines.
Current usage metrics show cumulative count of Article Views (full-text article views including HTML views, PDF and ePub downloads, according to the available data) and Abstracts Views on Vision4Press platform.
Data correspond to usage on the plateform after 2015. The current usage metrics is available 48-96 hours after online publication and is updated daily on week days.
Initial download of the metrics may take a while.