Free Access
Fig. 5
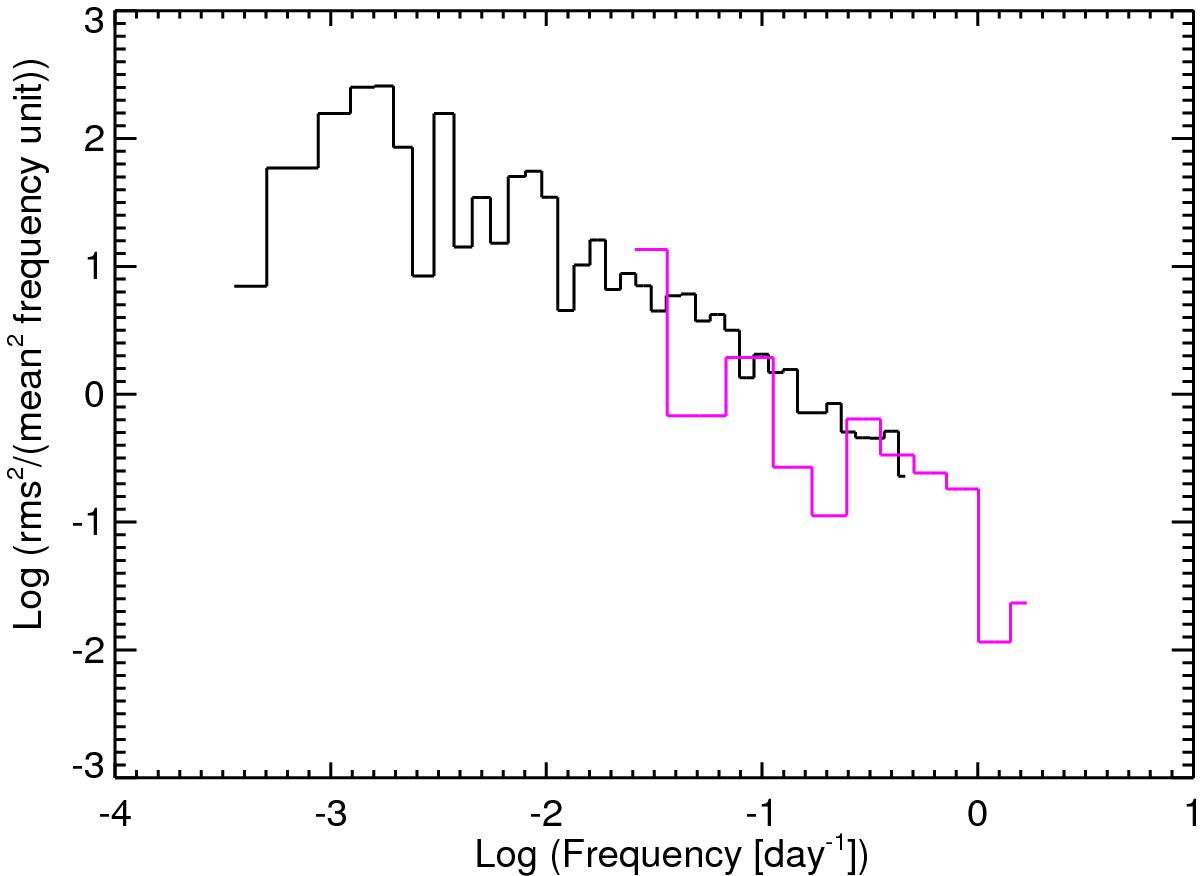
Power density spectrum normalized to variance per frequency unit for the mission-long Fermi-LAT light curve (black) and for the 2015 flare epoch (magenta).
Current usage metrics show cumulative count of Article Views (full-text article views including HTML views, PDF and ePub downloads, according to the available data) and Abstracts Views on Vision4Press platform.
Data correspond to usage on the plateform after 2015. The current usage metrics is available 48-96 hours after online publication and is updated daily on week days.
Initial download of the metrics may take a while.