Fig. 3
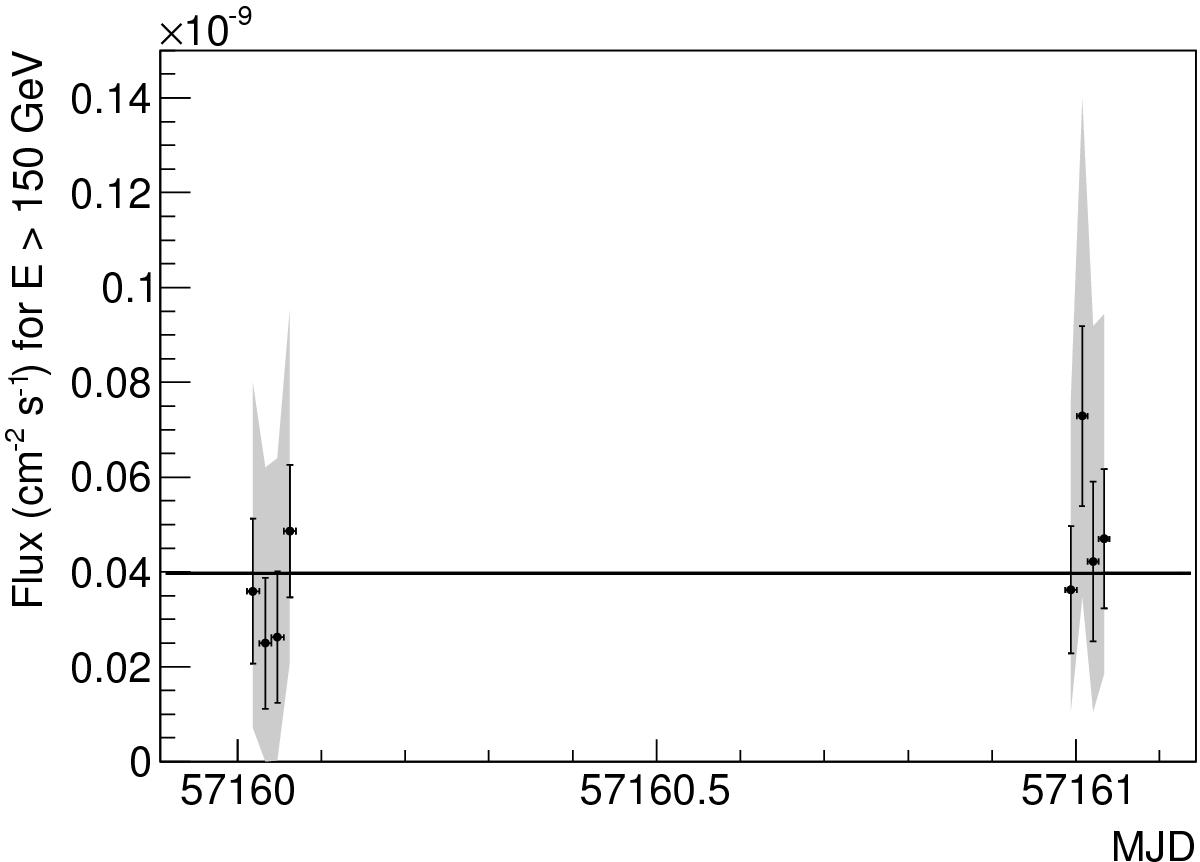
Light curve above 150 GeV obtained with the MAGIC telescopes during the flare in Period A. The fluxes are computed in 20 min bins. The black line shows the constant flux fit, (4.0 ± 0.5) × 10-11 cm-2s-1. The gray band shows the 95% confidence level interval allowing for 20% variable systematic uncertainty (see text for details).
Current usage metrics show cumulative count of Article Views (full-text article views including HTML views, PDF and ePub downloads, according to the available data) and Abstracts Views on Vision4Press platform.
Data correspond to usage on the plateform after 2015. The current usage metrics is available 48-96 hours after online publication and is updated daily on week days.
Initial download of the metrics may take a while.