Fig. 2
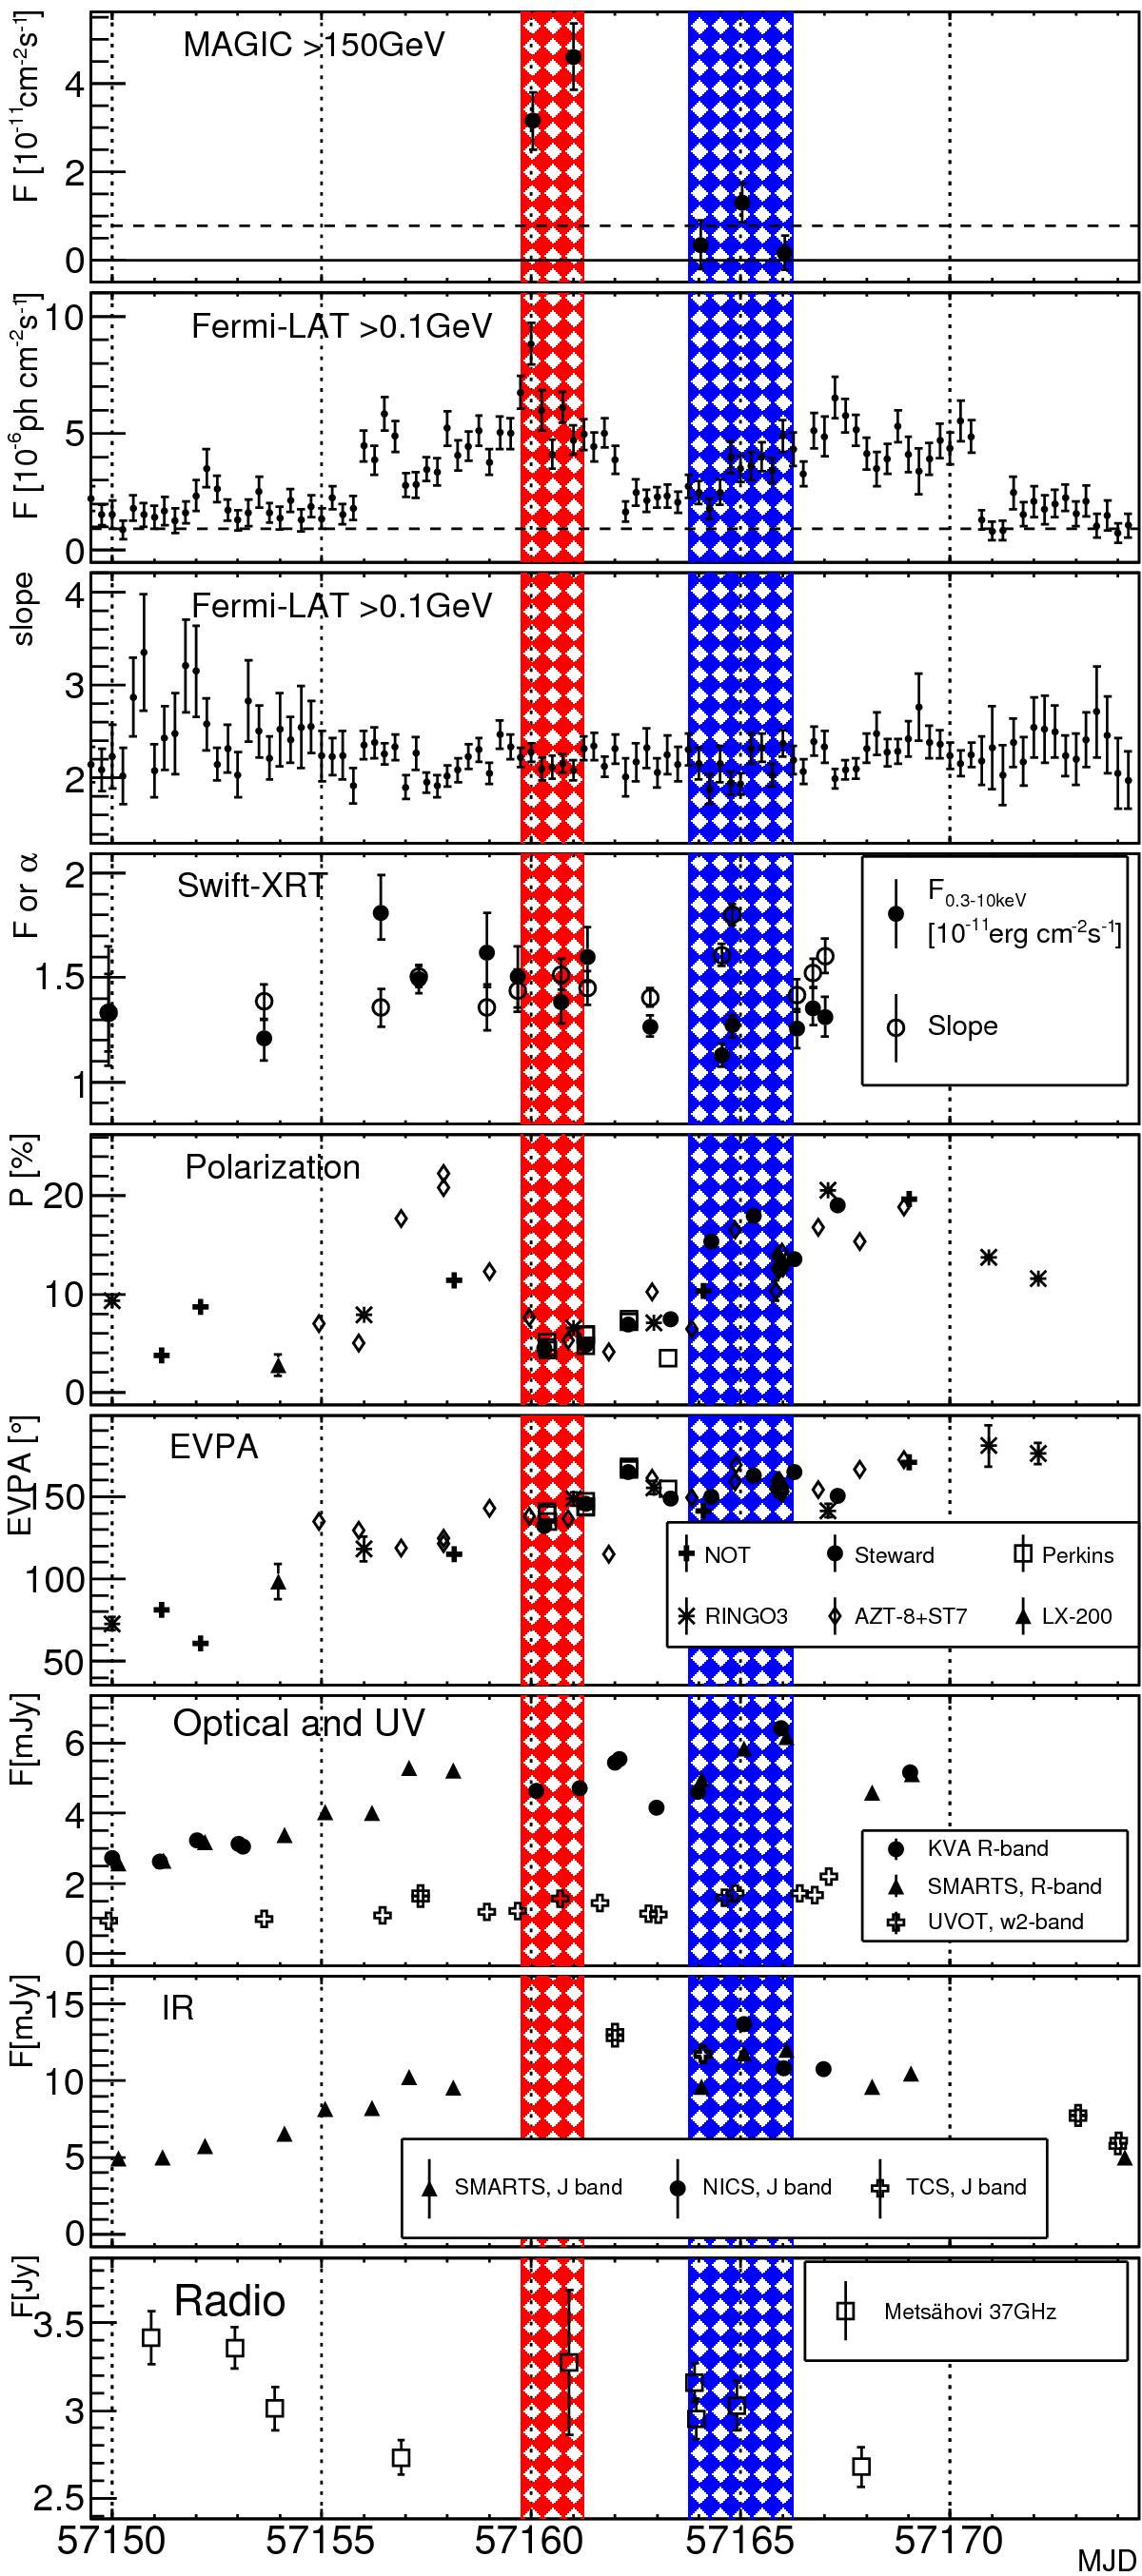
Multiwavelength light curve of PKS 1510−089 during the May 2015 flare. From top to bottom: nightly gamma-ray flux above 150 GeV from MAGIC (the dashed line shows the average emission in Feb.−Apr. 2012, Aleksić et al. 2014); Fermi-LAT flux above 0.1 GeV in 6 h binning, and the corresponding spectral index (the dashed line shows the average emission from the 3FGL catalog, Acero et al. 2015); X-ray spectral flux (filled circles) and spectral index (empty circles) measured by Swift-XRT; polarization percentage and polarization angle measured by NOT, Steward, Perkins, RINGO3, AZT-8, and LX-200 (see legend); optical emission in R band (KVA, SMARTS) and UV emission in w2-band (Swift-UVOT); IR emission in J band (SMARTS, MIRO-NICS, TCS); radio observations by Metsähovi at 37 GHz. Data from IR to UV are corrected for Galactic absorption. The red and blue shaded regions show Period A and Period B, respectively, for which the spectral modeling is performed.
Current usage metrics show cumulative count of Article Views (full-text article views including HTML views, PDF and ePub downloads, according to the available data) and Abstracts Views on Vision4Press platform.
Data correspond to usage on the plateform after 2015. The current usage metrics is available 48-96 hours after online publication and is updated daily on week days.
Initial download of the metrics may take a while.