Fig. 10
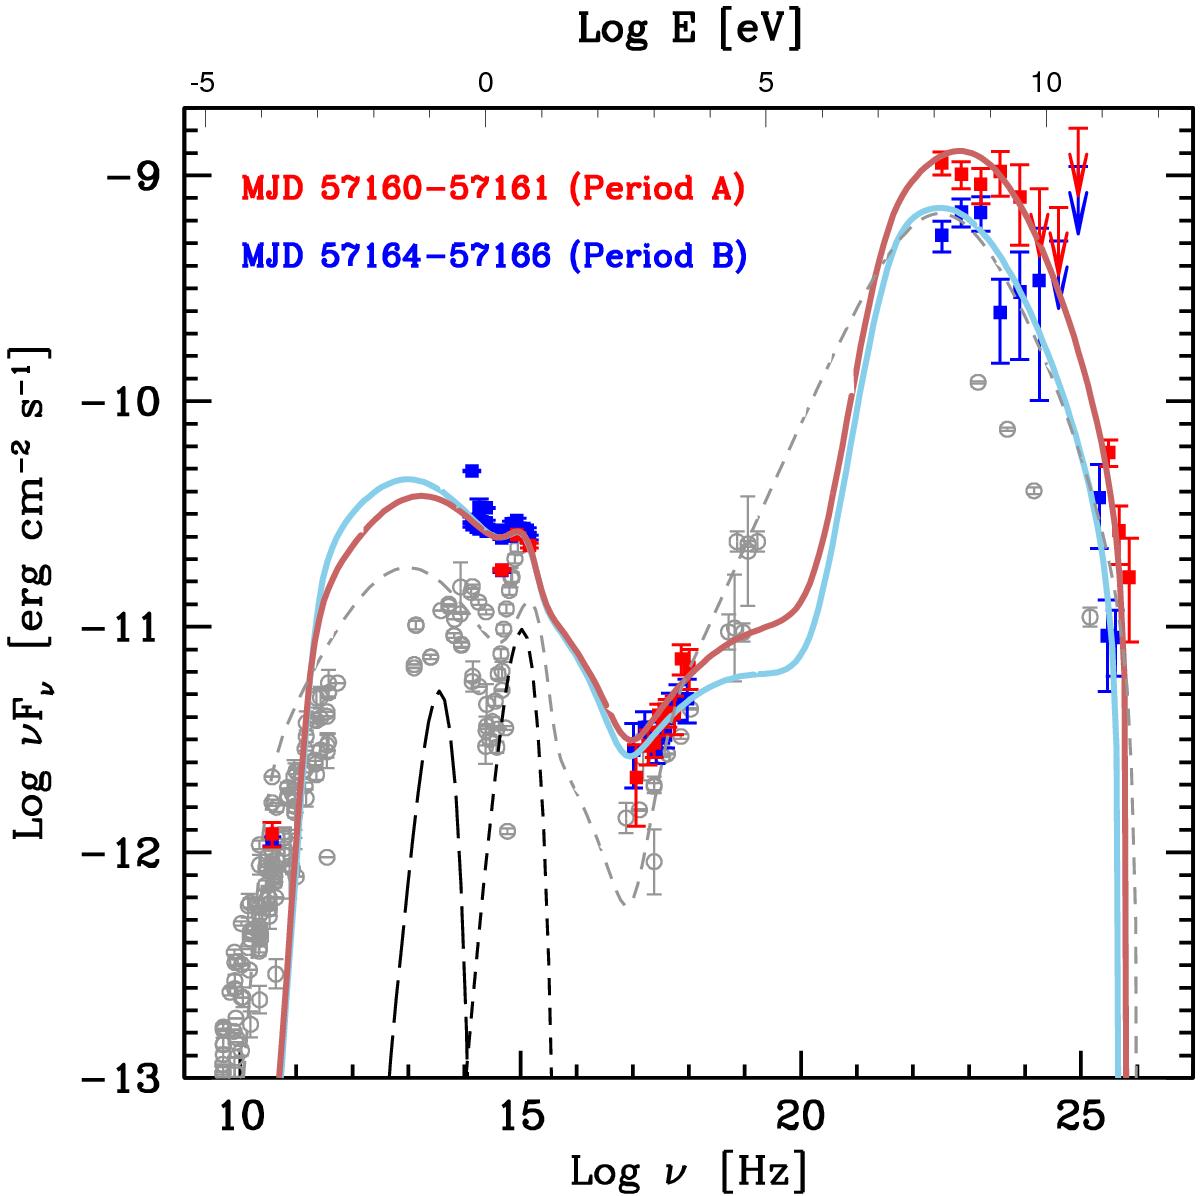
Multiwavelength spectral energy distribution of PKS 1510−089 in Periods A (red symbols) and B (blue symbols). The red and the blue curves show the result of the emission model for the two periods. The black dashed and long-dashed lines show the adopted emission for the accretion disk and the dusty torus, respectively. For comparison, the dashed gray line shows the model derived for the SED in 2012 (from Aleksić et al. 2014). Historical measurements (ASDC, see http://www.asdc.asi.it/) are shown as gray points.
Current usage metrics show cumulative count of Article Views (full-text article views including HTML views, PDF and ePub downloads, according to the available data) and Abstracts Views on Vision4Press platform.
Data correspond to usage on the plateform after 2015. The current usage metrics is available 48-96 hours after online publication and is updated daily on week days.
Initial download of the metrics may take a while.