Fig. 1
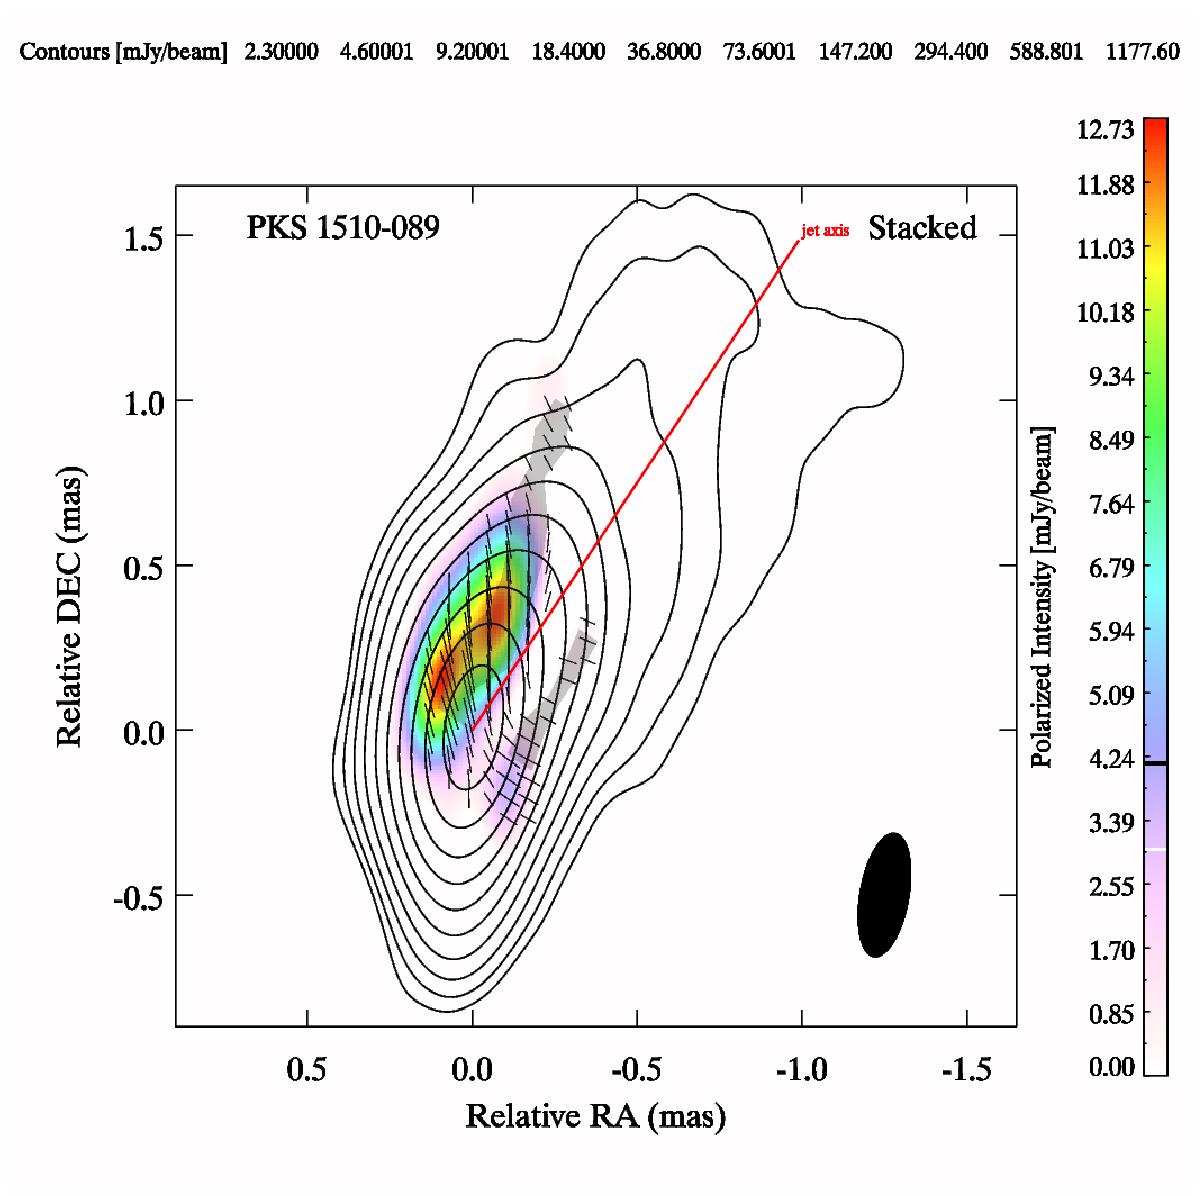
Stacked map of 43 GHz total (black contours) and polarized (color scale) intensity images of the inner pc-scale jet of PKS 1510−089 with the direction of electric field vector polarization denoted by black line segments (contour levels are indicated at the top, polarized flux levels are shown in the color bar to the right). All images have been convolved with the same Gaussian beam, shown in the lower right corner.
Current usage metrics show cumulative count of Article Views (full-text article views including HTML views, PDF and ePub downloads, according to the available data) and Abstracts Views on Vision4Press platform.
Data correspond to usage on the plateform after 2015. The current usage metrics is available 48-96 hours after online publication and is updated daily on week days.
Initial download of the metrics may take a while.