Fig. 8
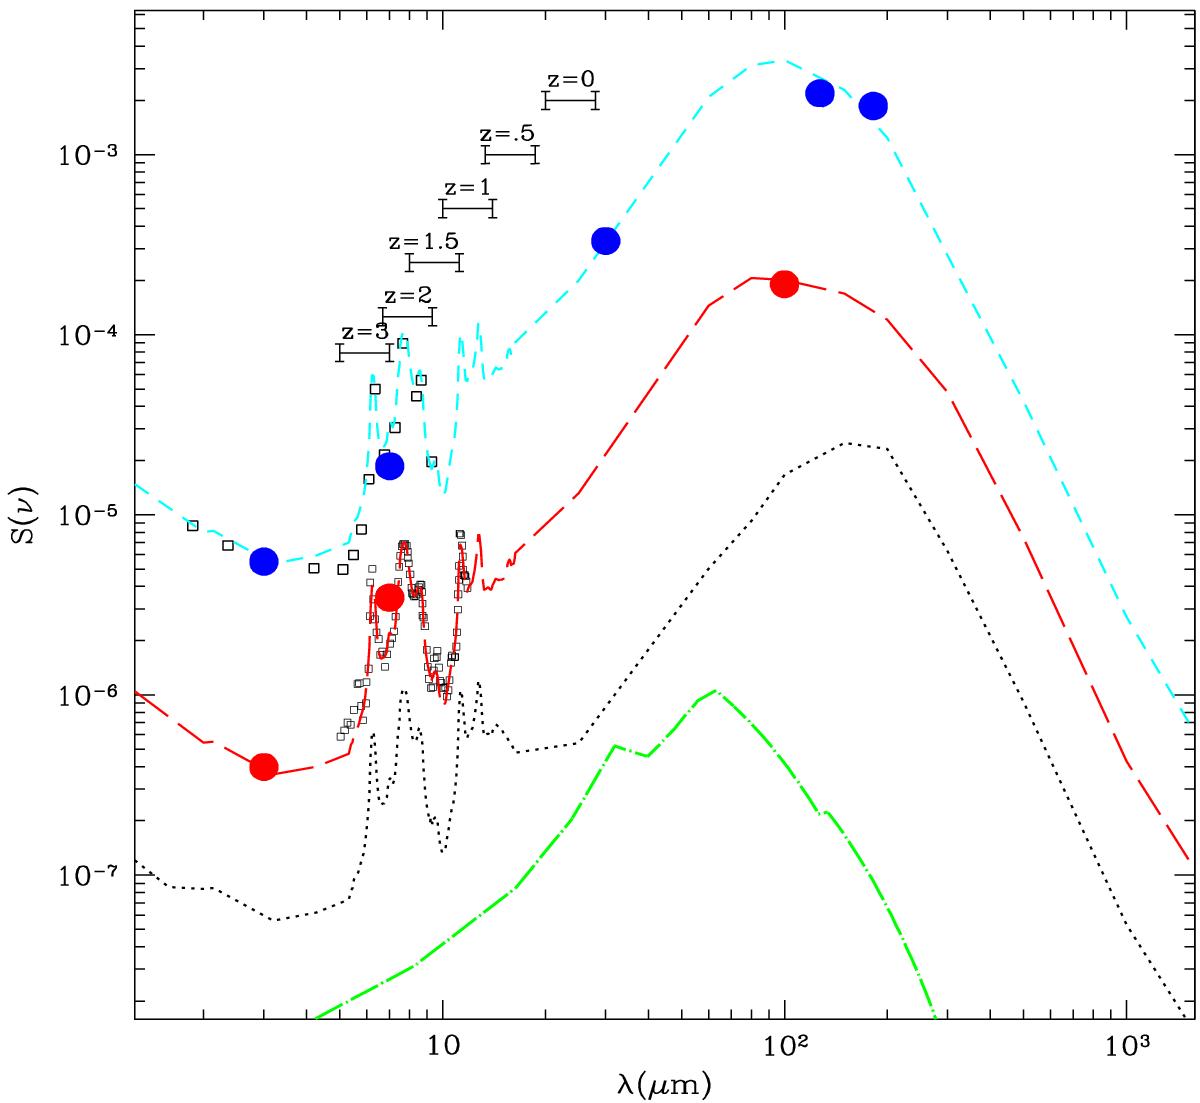
Our adopted IR spectra of various galaxy populations. The short-dashed cyan line corresponds to our adopted spectrum for the moderate-luminosity LIRG star-forming population, while the red long-dashed curve is the spectrum of high-luminosity ULIRG sources. In both cases the spectra are similar to that of the prototype star forming galaxy M 82 (in the range from 5 to 18 μm it is precisely the ISOCAM CVF spectrum of M 82). The lower dotted line corresponds to a low-luminosity inactive spiral (see Sect. 3.2 and AF2010), while the upper dotted line is closer to that of ULIRGs. The lower dot-dash green line is the average type-I AGN spectrum. The boundaries of the MIPS 24 μm filter are also shown in the source rest-frames at various source redshifts. The open squares are the average fluxes estimated by Fadda et al. (2010) for a faint sample of LIRGs at z ~ 1 and ULIRGs at z ~ 2. The two blue filled circles at 127 and 182 μm and the red filled datapoint at 100 μm are the average fluxes for LIRGs and ULIRGs from Herschel observations.
Current usage metrics show cumulative count of Article Views (full-text article views including HTML views, PDF and ePub downloads, according to the available data) and Abstracts Views on Vision4Press platform.
Data correspond to usage on the plateform after 2015. The current usage metrics is available 48-96 hours after online publication and is updated daily on week days.
Initial download of the metrics may take a while.