Fig. 2
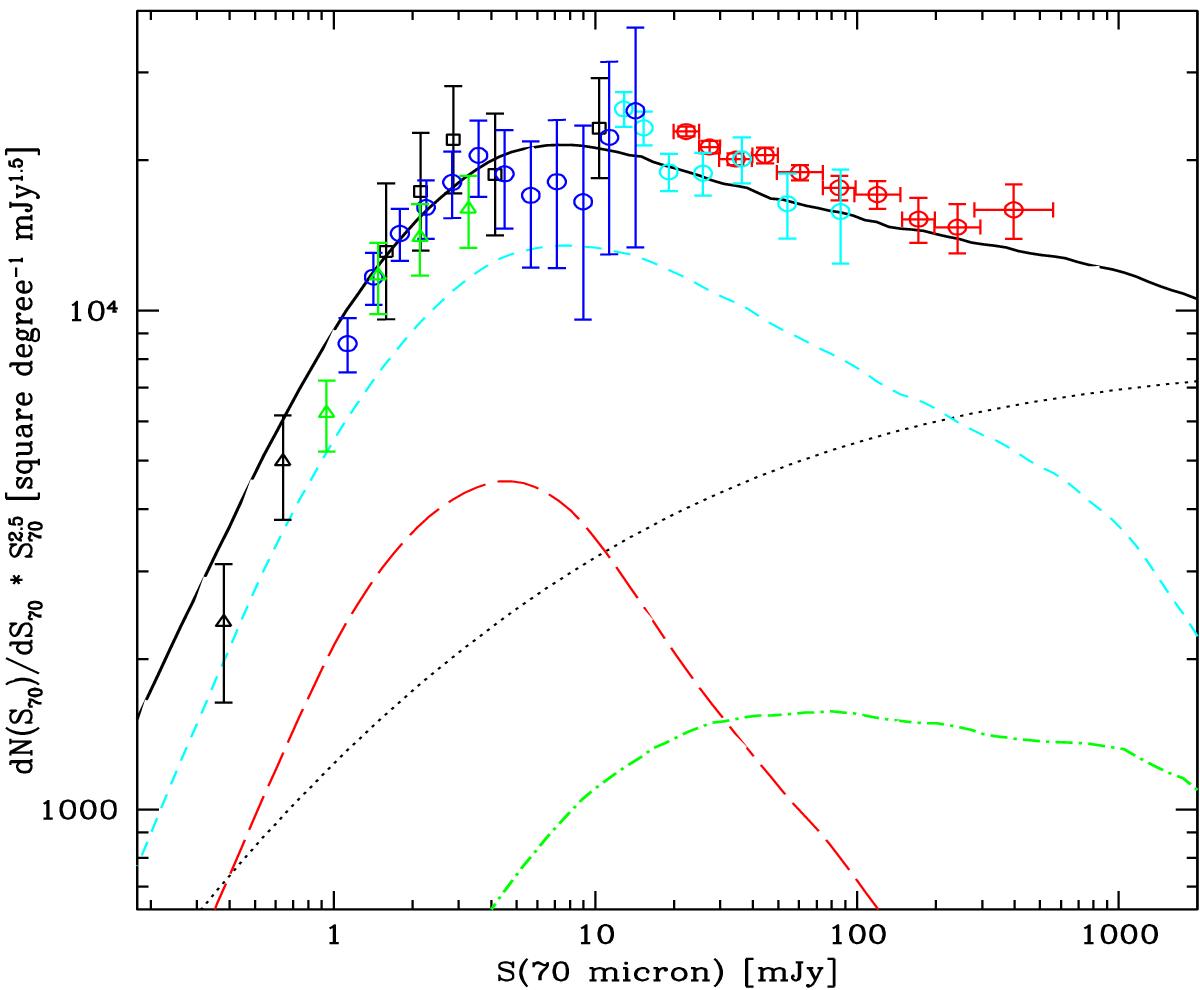
Euclidean-normalized differential number counts of extragalactic sources at 70 μm compared with our model fit. The blue open circles are from Berta et al. (2011), black triangles from Bethermin et al. 2010). Other datapoints are as reported in AF2010. The cyan short-dashed line is the LIRG and the red long-dashed line the ULIRG populations. Black dotted and green dot-dash lines are the normal spiral and type-1 AGN sources (see Sect. 3 for our population decomposition).
Current usage metrics show cumulative count of Article Views (full-text article views including HTML views, PDF and ePub downloads, according to the available data) and Abstracts Views on Vision4Press platform.
Data correspond to usage on the plateform after 2015. The current usage metrics is available 48-96 hours after online publication and is updated daily on week days.
Initial download of the metrics may take a while.