Fig. 16
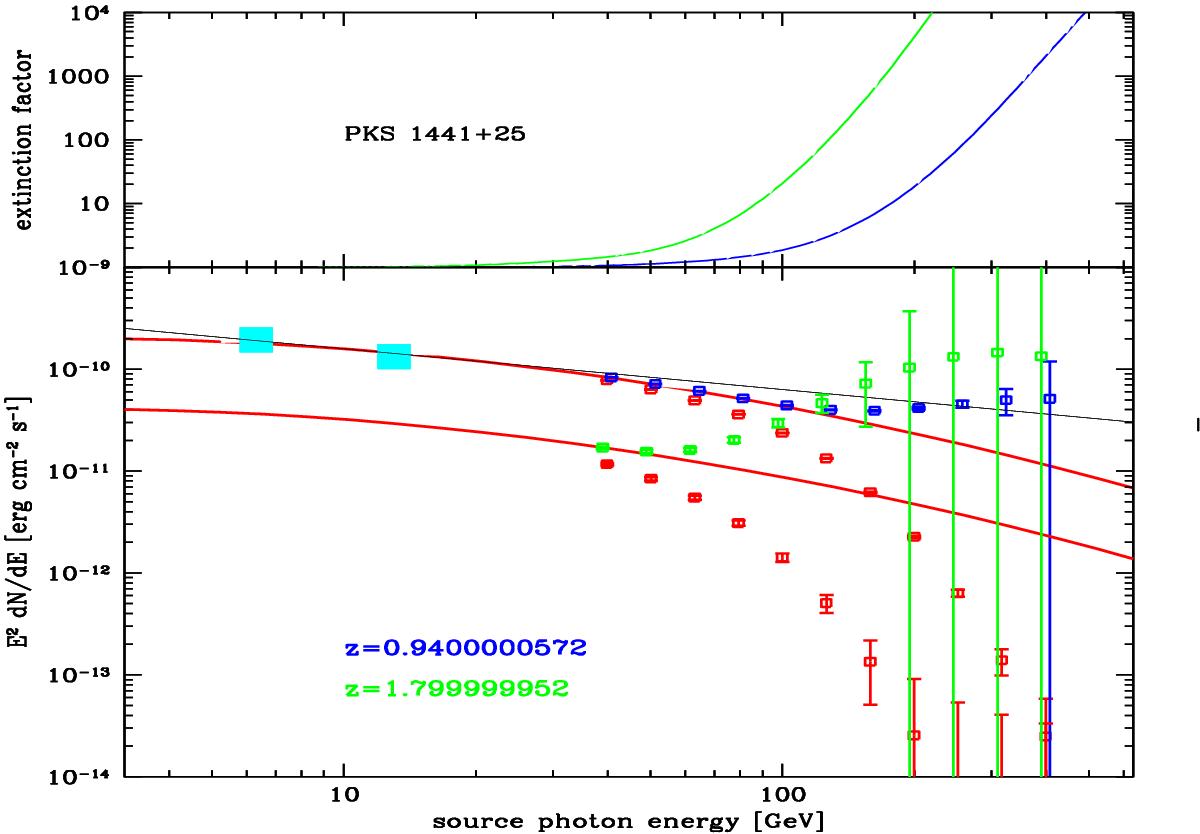
Similar to Fig. 15, but including simulations of the performances of future observations with the CTA array (50 h observations) and different spectral corrections for photon-photon absorption. Cyan and red datapoints as in the previous figure. Here we assume the existence of a diffuse excess background in the near-IR from very high redshift sources (Population III objects), on top of our estimated EBL in the present paper. The figure includes a simulation of future observations of a similar gamma-ray source observed at the redshift z = 1.8 with the CTA array, to show how sensitive the instrument will be in constraining truly diffuse background signals from un-resolved high-redshift source population.
Current usage metrics show cumulative count of Article Views (full-text article views including HTML views, PDF and ePub downloads, according to the available data) and Abstracts Views on Vision4Press platform.
Data correspond to usage on the plateform after 2015. The current usage metrics is available 48-96 hours after online publication and is updated daily on week days.
Initial download of the metrics may take a while.