Fig. 1
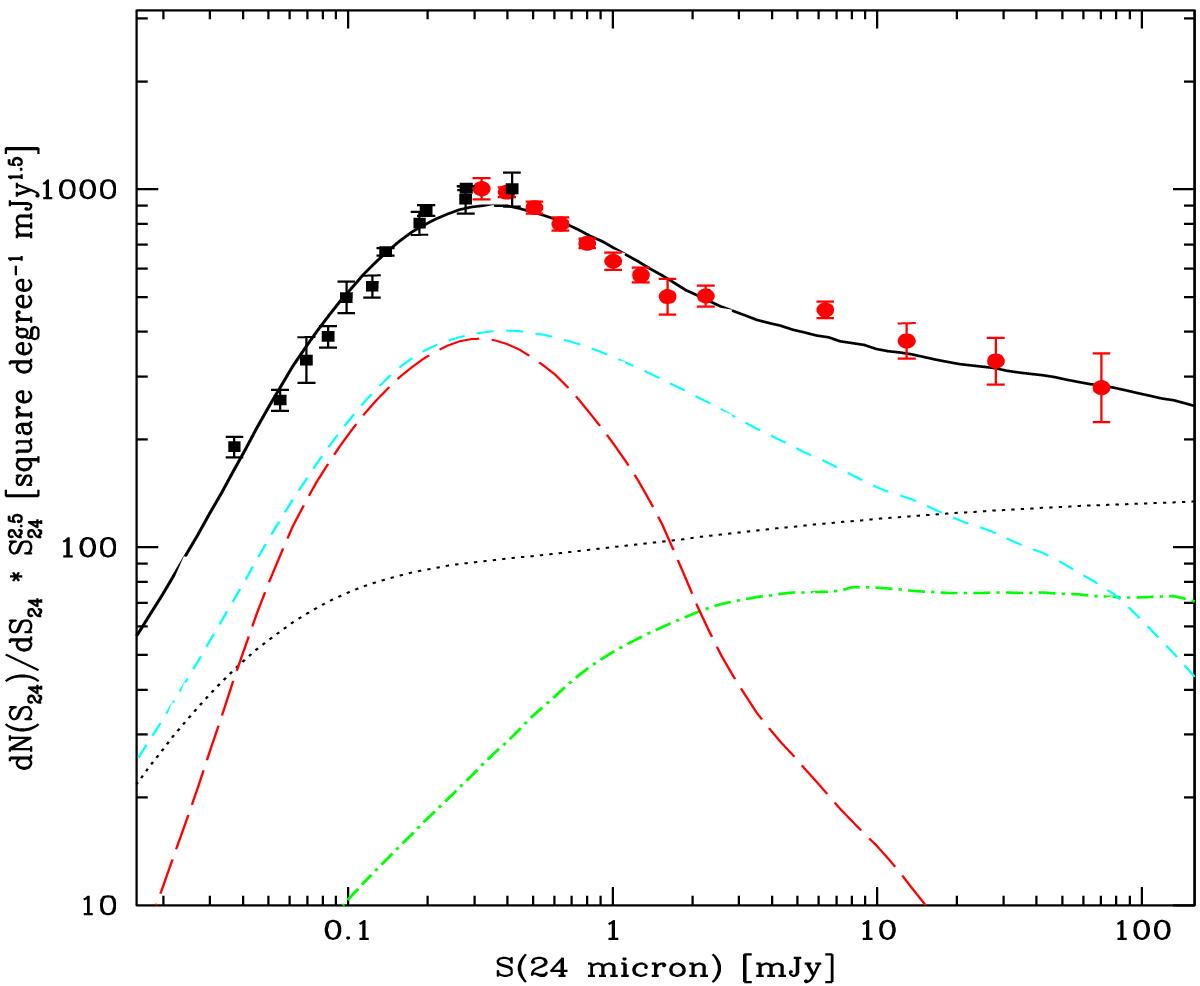
Euclidean-normalized differential number counts of extragalactic sources at 24 μm compared with our model fit. The red circles are from the analysis of SWIRE survey data by Shupe et al. (2008), black squares from Papovich et al. (2004). The contribution by type-I AGNs is shown as green dot-dashed line, moderate-luminosity starbursts (the LIRGs) make the cyan short-dash line (type-II AGNs and starbursts are included in the same population on the assumption that in both classes the IR spectrum is dominated by starburst emission). The red long-dashed line corresponds to the population of high-luminosity sources dominating the IR emissivity at high redshifts. The dotted line is the separate contribution of normal spirals, while the continuous line is the total model counts.
Current usage metrics show cumulative count of Article Views (full-text article views including HTML views, PDF and ePub downloads, according to the available data) and Abstracts Views on Vision4Press platform.
Data correspond to usage on the plateform after 2015. The current usage metrics is available 48-96 hours after online publication and is updated daily on week days.
Initial download of the metrics may take a while.