Fig. 6
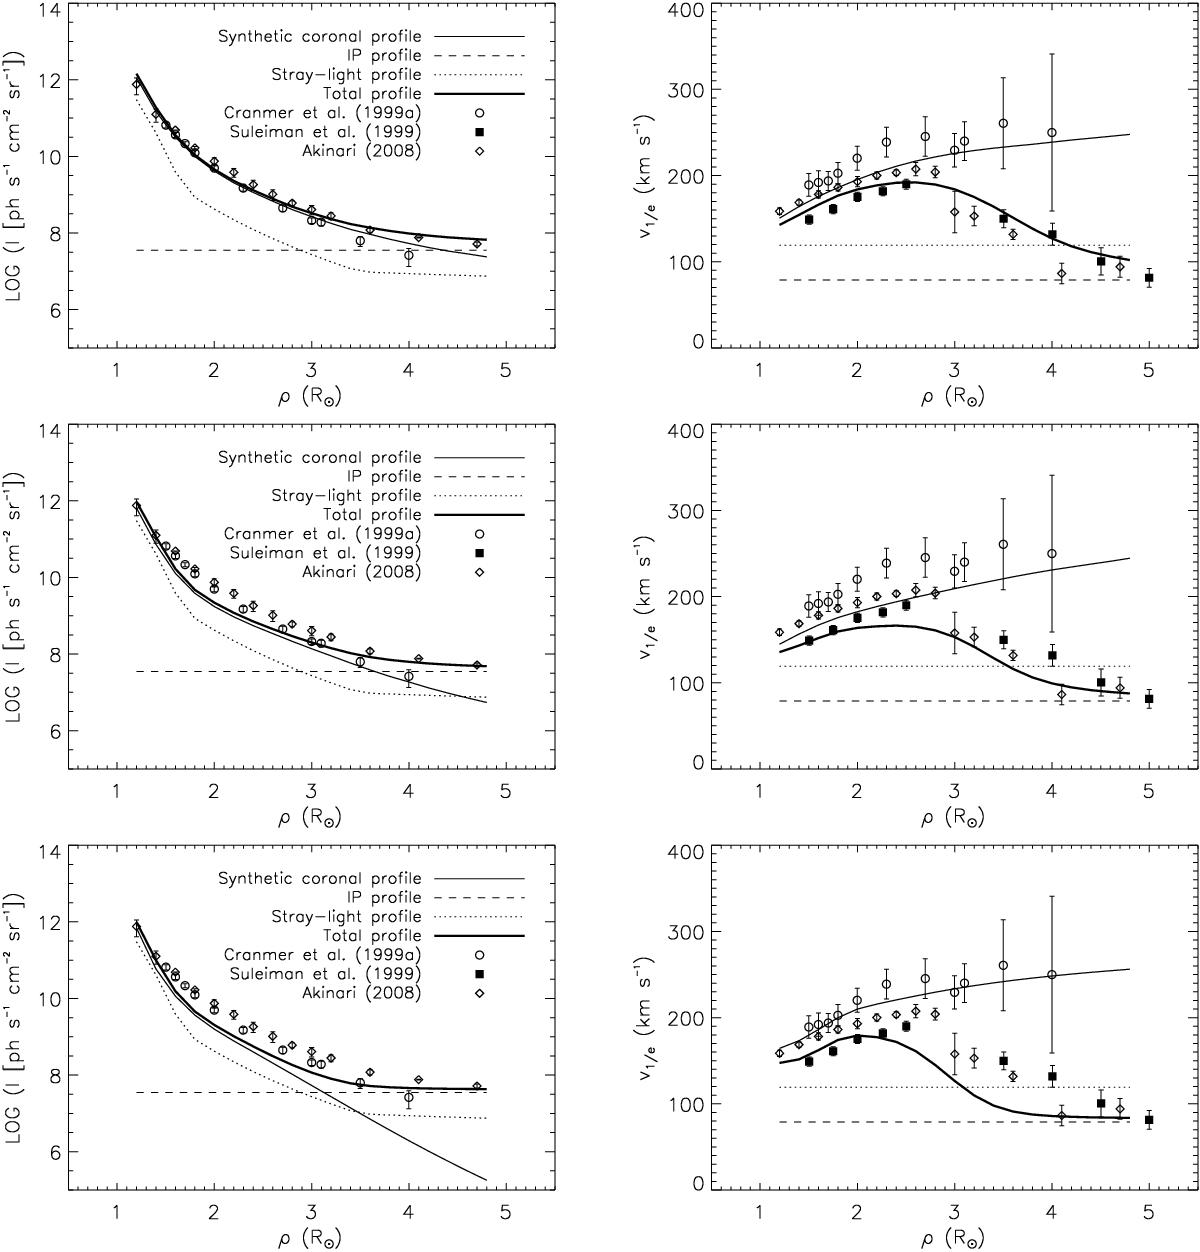
Synthesised Lyα line intensities (left panels) and 1/e half widths of the H I velocity distribution (right panels) vs. heliocentric distance, compared with the values deduced by the observations of several authors. Top panels report the results of our model, middle panels those of the model of Guhathakurta et al. (1999), and bottom panels those of the model A2 of Cranmer et al. (1999a).
Current usage metrics show cumulative count of Article Views (full-text article views including HTML views, PDF and ePub downloads, according to the available data) and Abstracts Views on Vision4Press platform.
Data correspond to usage on the plateform after 2015. The current usage metrics is available 48-96 hours after online publication and is updated daily on week days.
Initial download of the metrics may take a while.