Fig. 2
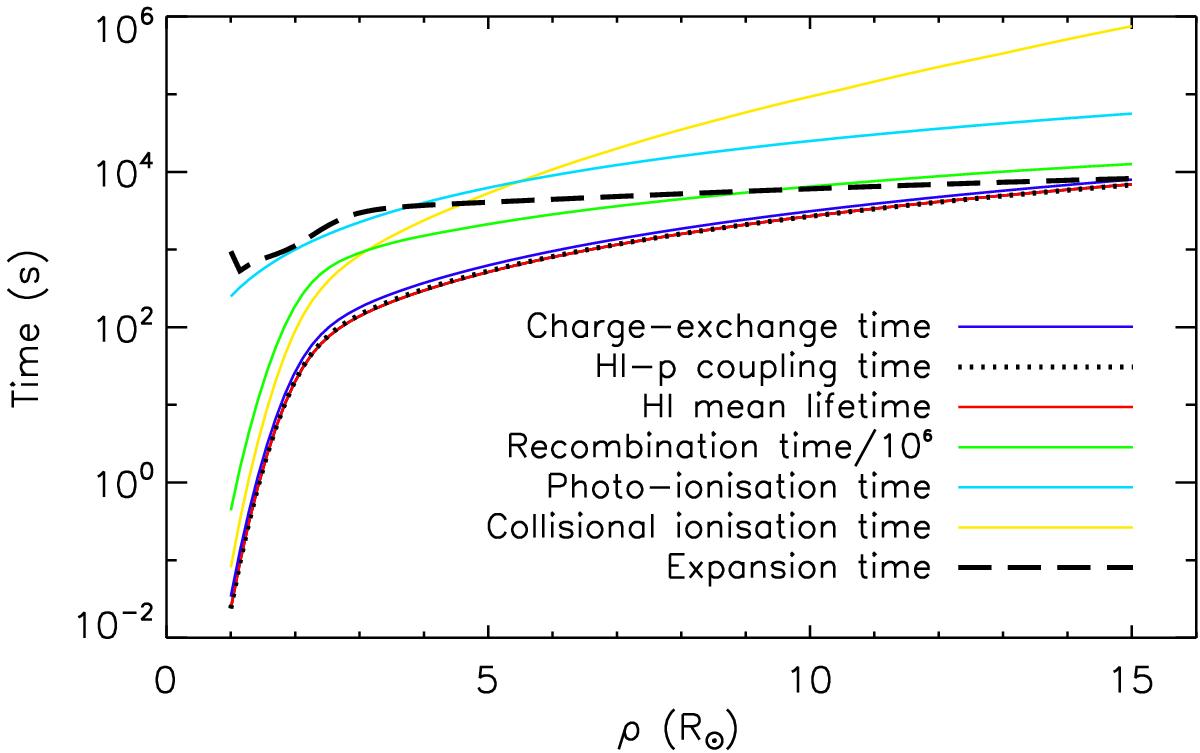
H I mean lifetime (red line) and theoretical timescales computed for charge-exchange (blue line), H I-p coupling (dotted line), recombination (green line), photo-ionisation (light blue line), collisional ionisation (yellow line), and solar wind expansion (dashed line), as functions of the heliocentric distance for our coronal hole model. The H I mean lifetime and the H I-p coupling time curves overlap each other.
Current usage metrics show cumulative count of Article Views (full-text article views including HTML views, PDF and ePub downloads, according to the available data) and Abstracts Views on Vision4Press platform.
Data correspond to usage on the plateform after 2015. The current usage metrics is available 48-96 hours after online publication and is updated daily on week days.
Initial download of the metrics may take a while.