Fig. D.2
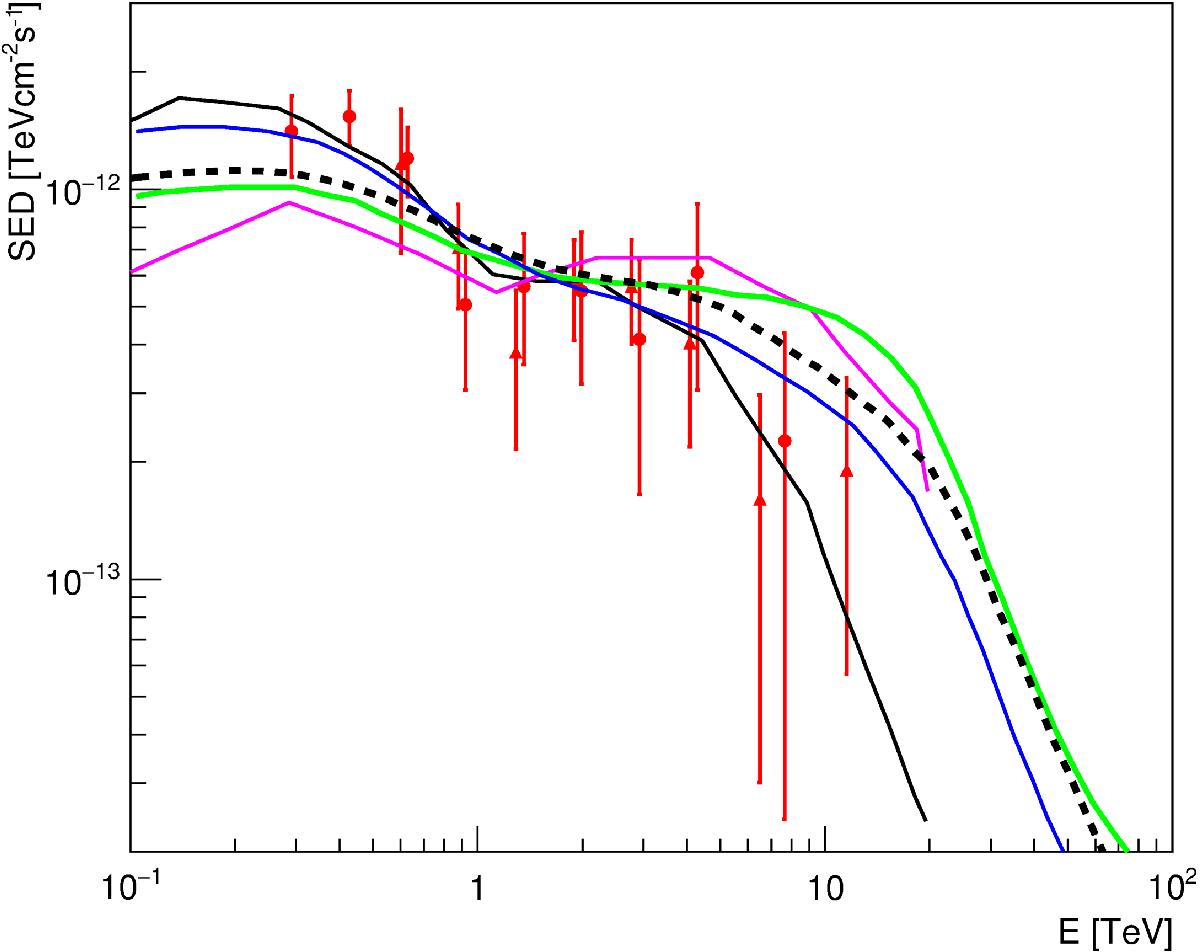
Comparison between the hadronic model from our work (black-dashed curve, power-law spectrum from 1 EeV to 100 EeV, γ = −2) with other works (solid curves). Black – Essey et al. (2011), high EBL intensity; magenta – Essey et al. (2011), low EBL intensity; green – Murase et al. (2012), KD10 EBL; blue – Murase et al. (2012), Kneiske et al. (2004) best-fit EBL.
Current usage metrics show cumulative count of Article Views (full-text article views including HTML views, PDF and ePub downloads, according to the available data) and Abstracts Views on Vision4Press platform.
Data correspond to usage on the plateform after 2015. The current usage metrics is available 48-96 hours after online publication and is updated daily on week days.
Initial download of the metrics may take a while.