Fig. D.1
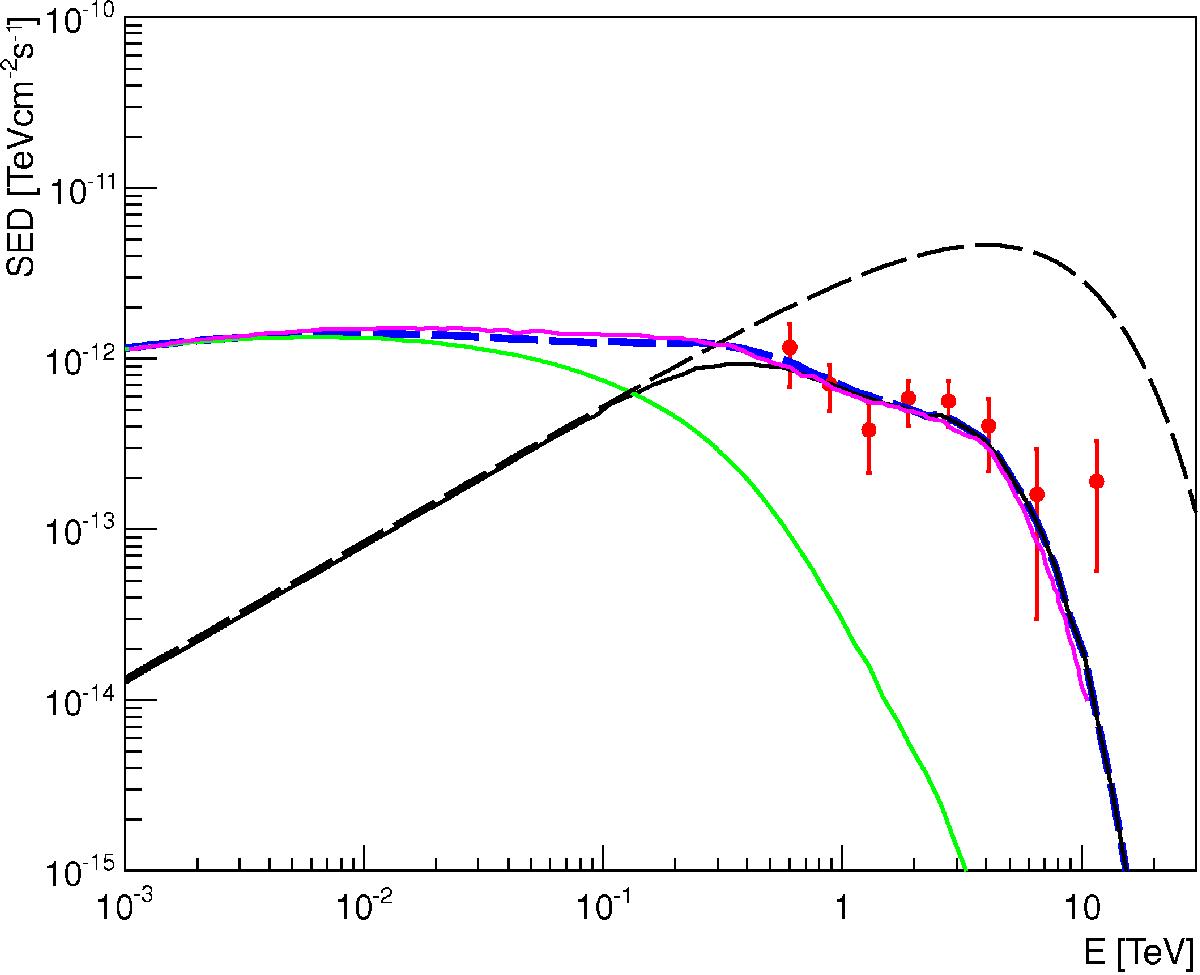
Comparison of our calculations with the ELMAG code and the result of Vovk et al. (2012) for z = 0.14. Magenta line denotes the total observable spectrum calculated by Vovk et al. (2012) and other lines denote our results: dashed black line – primary spectrum in the source, solid black line – absorbed primary component, solid green line – cascade component, dashed thick blue line – total model spectrum.
Current usage metrics show cumulative count of Article Views (full-text article views including HTML views, PDF and ePub downloads, according to the available data) and Abstracts Views on Vision4Press platform.
Data correspond to usage on the plateform after 2015. The current usage metrics is available 48-96 hours after online publication and is updated daily on week days.
Initial download of the metrics may take a while.