Fig. 16
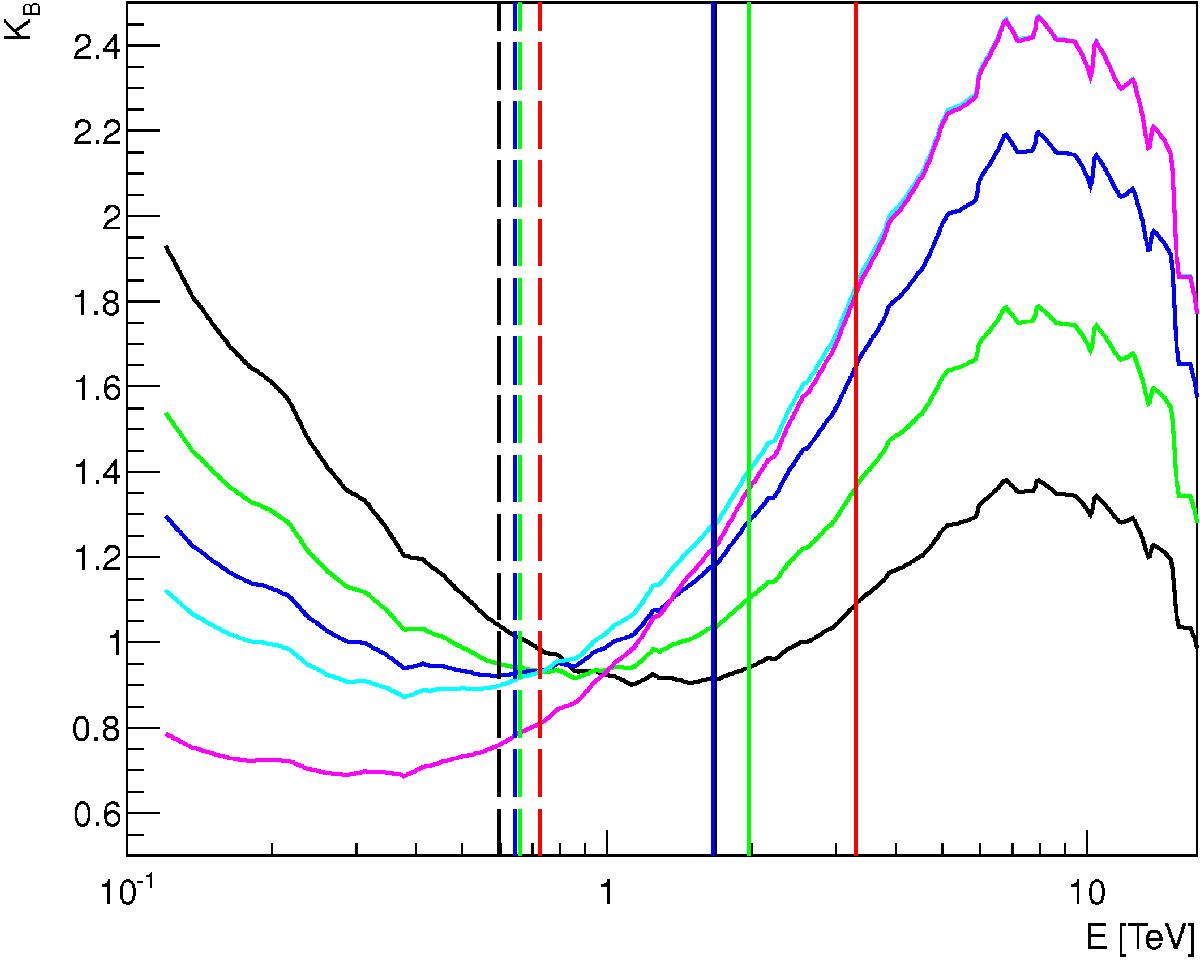
Boost factor KB vs. energy for the fits presented in Fig. 13. Solid lines denote KB(E) for different values of KV: black – KV = 1, green – 0.6, blue – 0.4, cyan – 0.3, magenta – 0.2. Dashed vertical lines denote the energy corresponding to τ = 1: black for the G12 EBL model, red – KD10, green – F08, blue – KD10 as implemented in the ELMAG code. Solid vertical lines denote the energy corresponding to τ = 2 (the same meaning of colours as for dashed vertical lines).
Current usage metrics show cumulative count of Article Views (full-text article views including HTML views, PDF and ePub downloads, according to the available data) and Abstracts Views on Vision4Press platform.
Data correspond to usage on the plateform after 2015. The current usage metrics is available 48-96 hours after online publication and is updated daily on week days.
Initial download of the metrics may take a while.