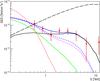
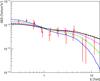
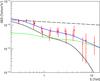
Fig. 14
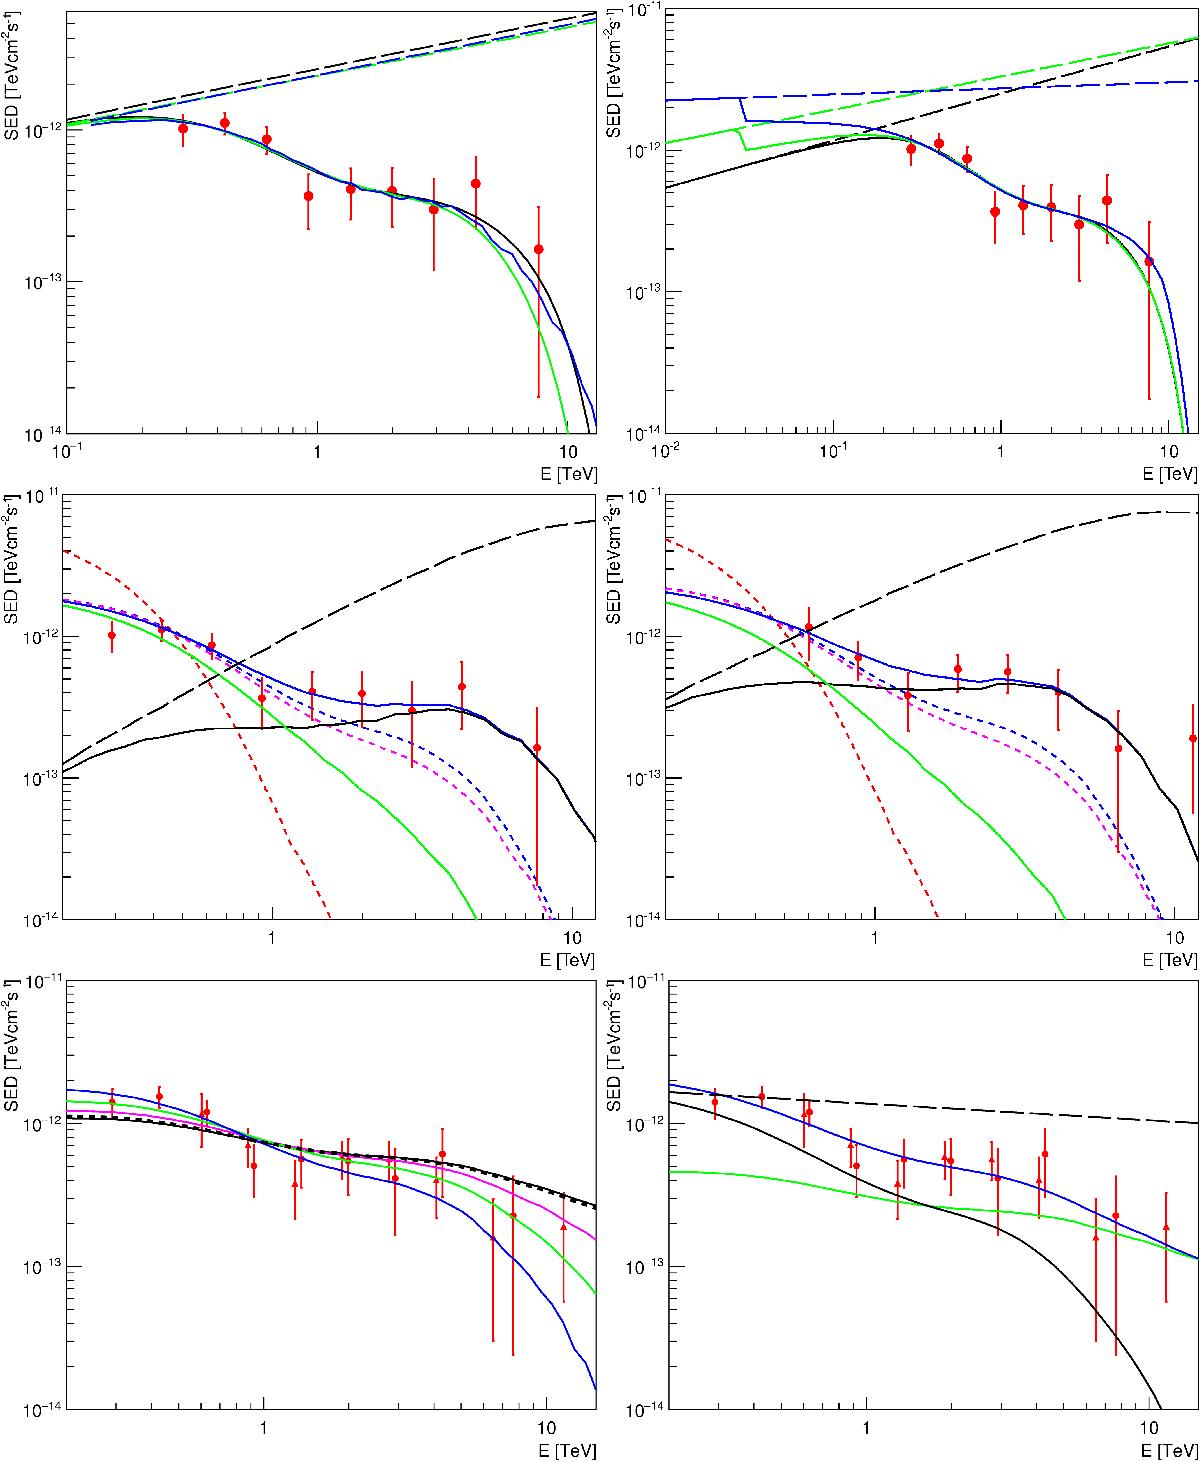
Model fits for the case of 1ES 0229+200. Top-left – absorption-only model, all notions are the same as in Fig. 11, top-left. Top-right – comparison of the absorption-only and γ-ALP mixing models: black line denotes absorption-only model, green – weak γ-ALP flux enhancement, blue – strong γ-ALP flux enhancement. Middle panels – electromagnetic cascade model for the case of the VERITAS (left) and H.E.S.S. (right, red triangles) observations together with cascade spectra for monoenergetic primary γ-ray injection (short-dashed lines): red – Eγ0 = 10 TeV, blue – Eγ0 = 100 TeV, magenta – Eγ0 = 1 PeV. Bottom-left – basic hadronic cascade model (zc are the same as in Fig. 12 middle-right); bottom-right – modified CR beam model.
Current usage metrics show cumulative count of Article Views (full-text article views including HTML views, PDF and ePub downloads, according to the available data) and Abstracts Views on Vision4Press platform.
Data correspond to usage on the plateform after 2015. The current usage metrics is available 48-96 hours after online publication and is updated daily on week days.
Initial download of the metrics may take a while.