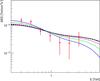
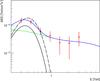
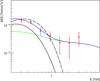
Fig. 12
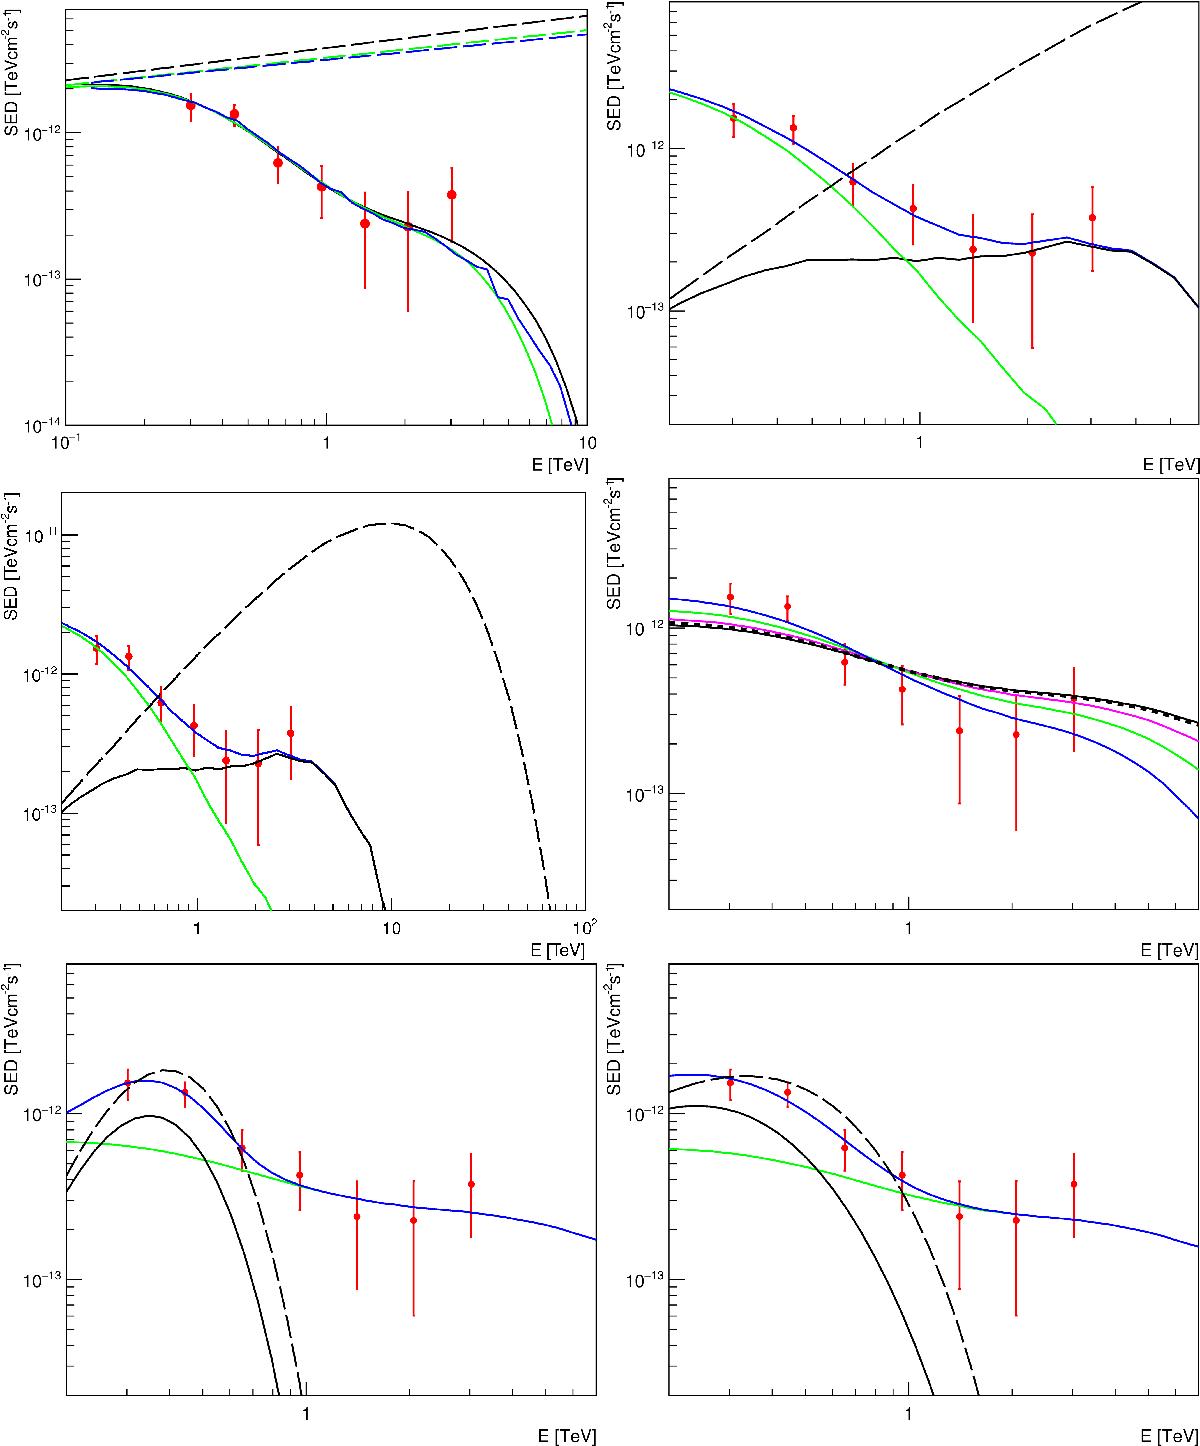
Model fits for the case of 1ES 0347-121. Red circles denote measurements, bars – their uncertainties; long-dashed lines – primary γ-ray spectra. Top-left – absorption-only model: black – G12 EBL model, green – F08, blue – KD10 model as implemented in ELMAG; solid lines – observable spectra. Top-right – electromagnetic cascade model: blue solid line denotes observable spectrum, black – absorbed component, green – cascade component. Middle-left: the same as for top-right, but showing the high-energy cutoff of the primary spectrum. Middle-right – basic hadronic model: black solid line denotes zc = 0, magenta – zc = 0.02, green – zc = 0.05, blue – zc = 0.10; short-dashed line – power-law spectrum of primary protons with zc = 0. Bottom-left – modified hadronic model, the same meaning of colours as in the middle-left panel. Bottom-right – another fit for the case of modified hadronic model.
Current usage metrics show cumulative count of Article Views (full-text article views including HTML views, PDF and ePub downloads, according to the available data) and Abstracts Views on Vision4Press platform.
Data correspond to usage on the plateform after 2015. The current usage metrics is available 48-96 hours after online publication and is updated daily on week days.
Initial download of the metrics may take a while.