Fig. 4
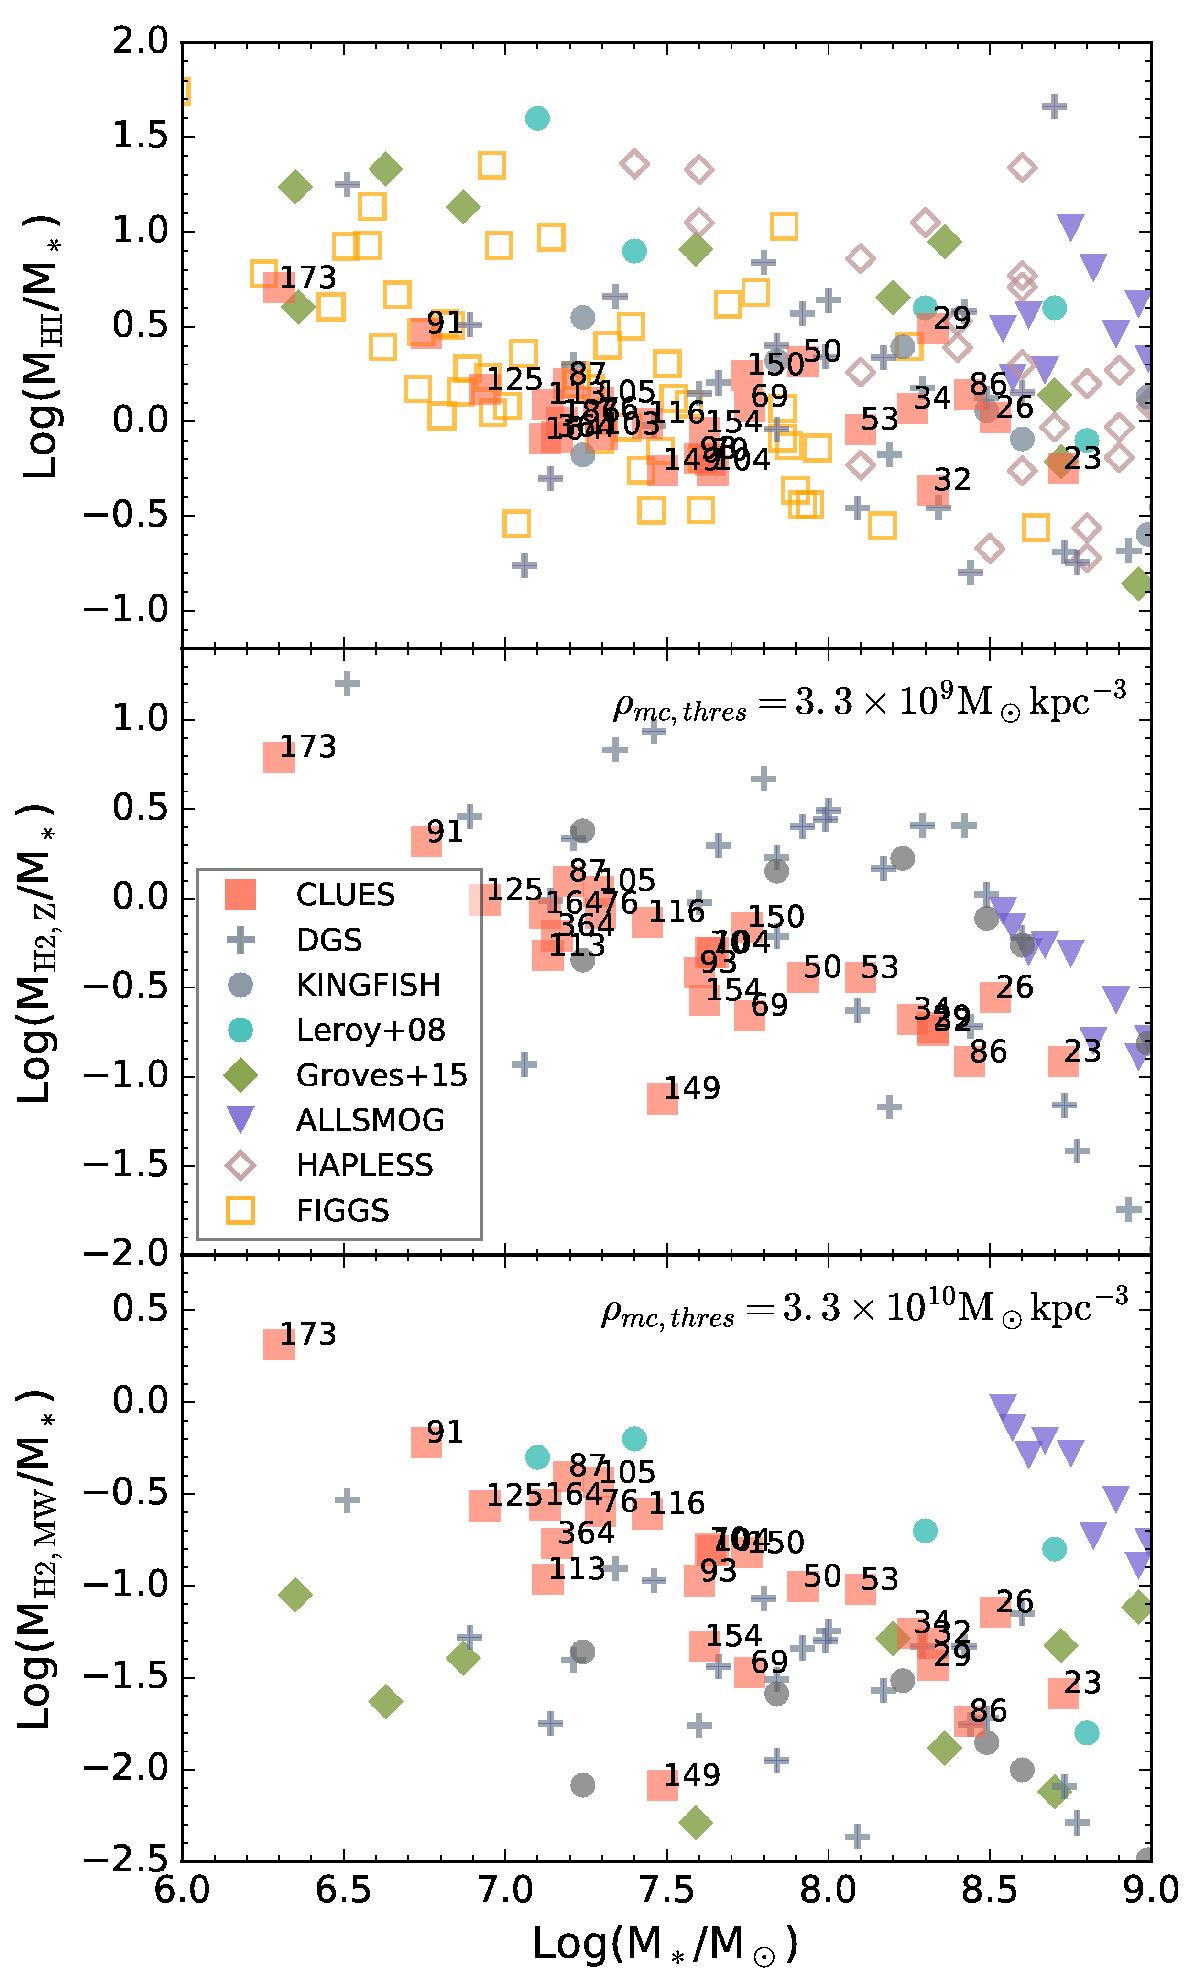
MHI/M∗ (upper panel) and MH2/M∗ (middle and lower panels) ratios versus stellar mass. CLUES simulated galaxies are shown as red squares, while the various observational samples take the symbols shown in the legend. HI and H2 masses are calculated by GRASIL-3D based on a log-normal PDF for gas densities. The middle and lower panels differ in the assumption for the observed galaxies of a metallicity-dependent or constant CO-to-H2 conversion factor, respectively, which in GRASIL-3D means the use of different density threshold values ρmc,thres in order to match observational data.
Current usage metrics show cumulative count of Article Views (full-text article views including HTML views, PDF and ePub downloads, according to the available data) and Abstracts Views on Vision4Press platform.
Data correspond to usage on the plateform after 2015. The current usage metrics is available 48-96 hours after online publication and is updated daily on week days.
Initial download of the metrics may take a while.