Free Access
Fig. 2
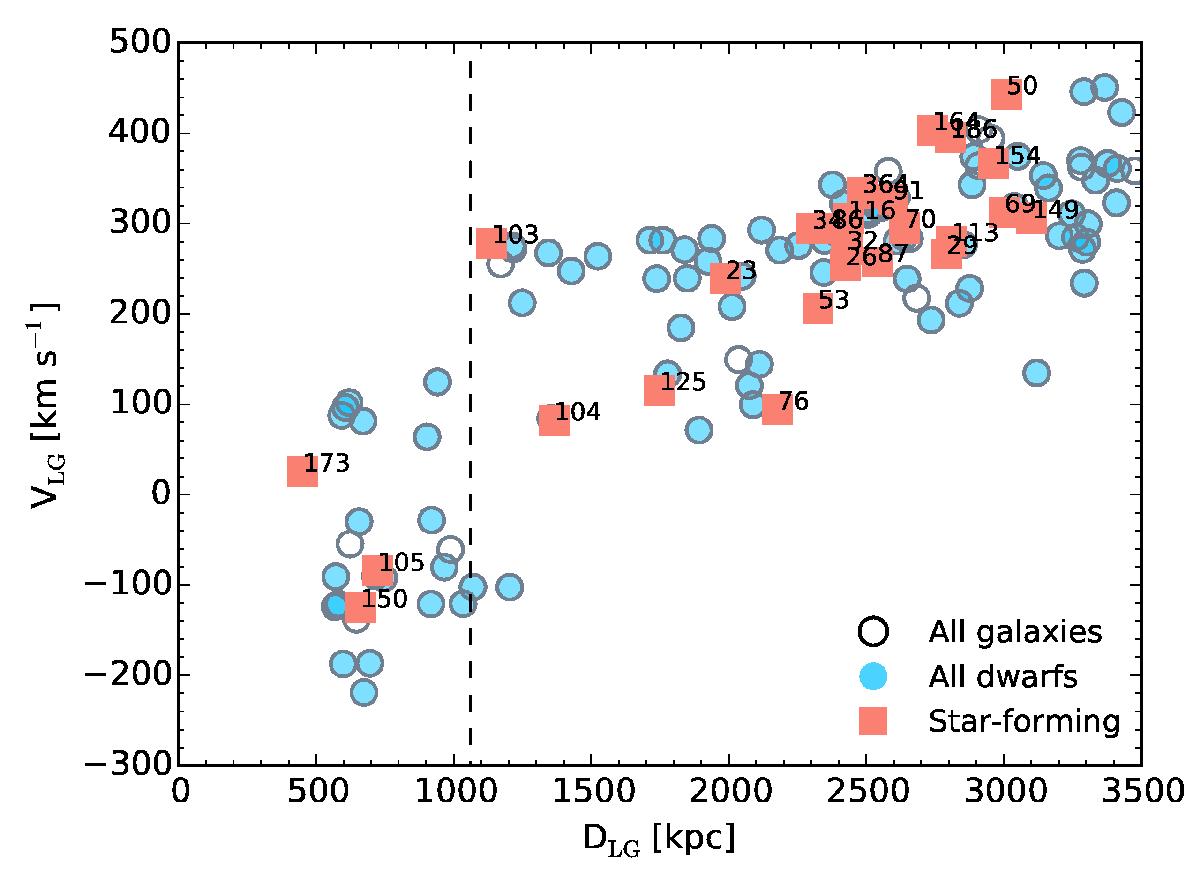
Distance to the CLUES Local Group barycenter versus the velocity relative to this barycenter. The color-coding is the same as in Fig. 1. The vertical dashed line indicates the observational zero-velocity surface of the Local Group (RLG = 1060 ± 70 kpc) as derived in McConnachie (2012).
Current usage metrics show cumulative count of Article Views (full-text article views including HTML views, PDF and ePub downloads, according to the available data) and Abstracts Views on Vision4Press platform.
Data correspond to usage on the plateform after 2015. The current usage metrics is available 48-96 hours after online publication and is updated daily on week days.
Initial download of the metrics may take a while.