Fig. 18
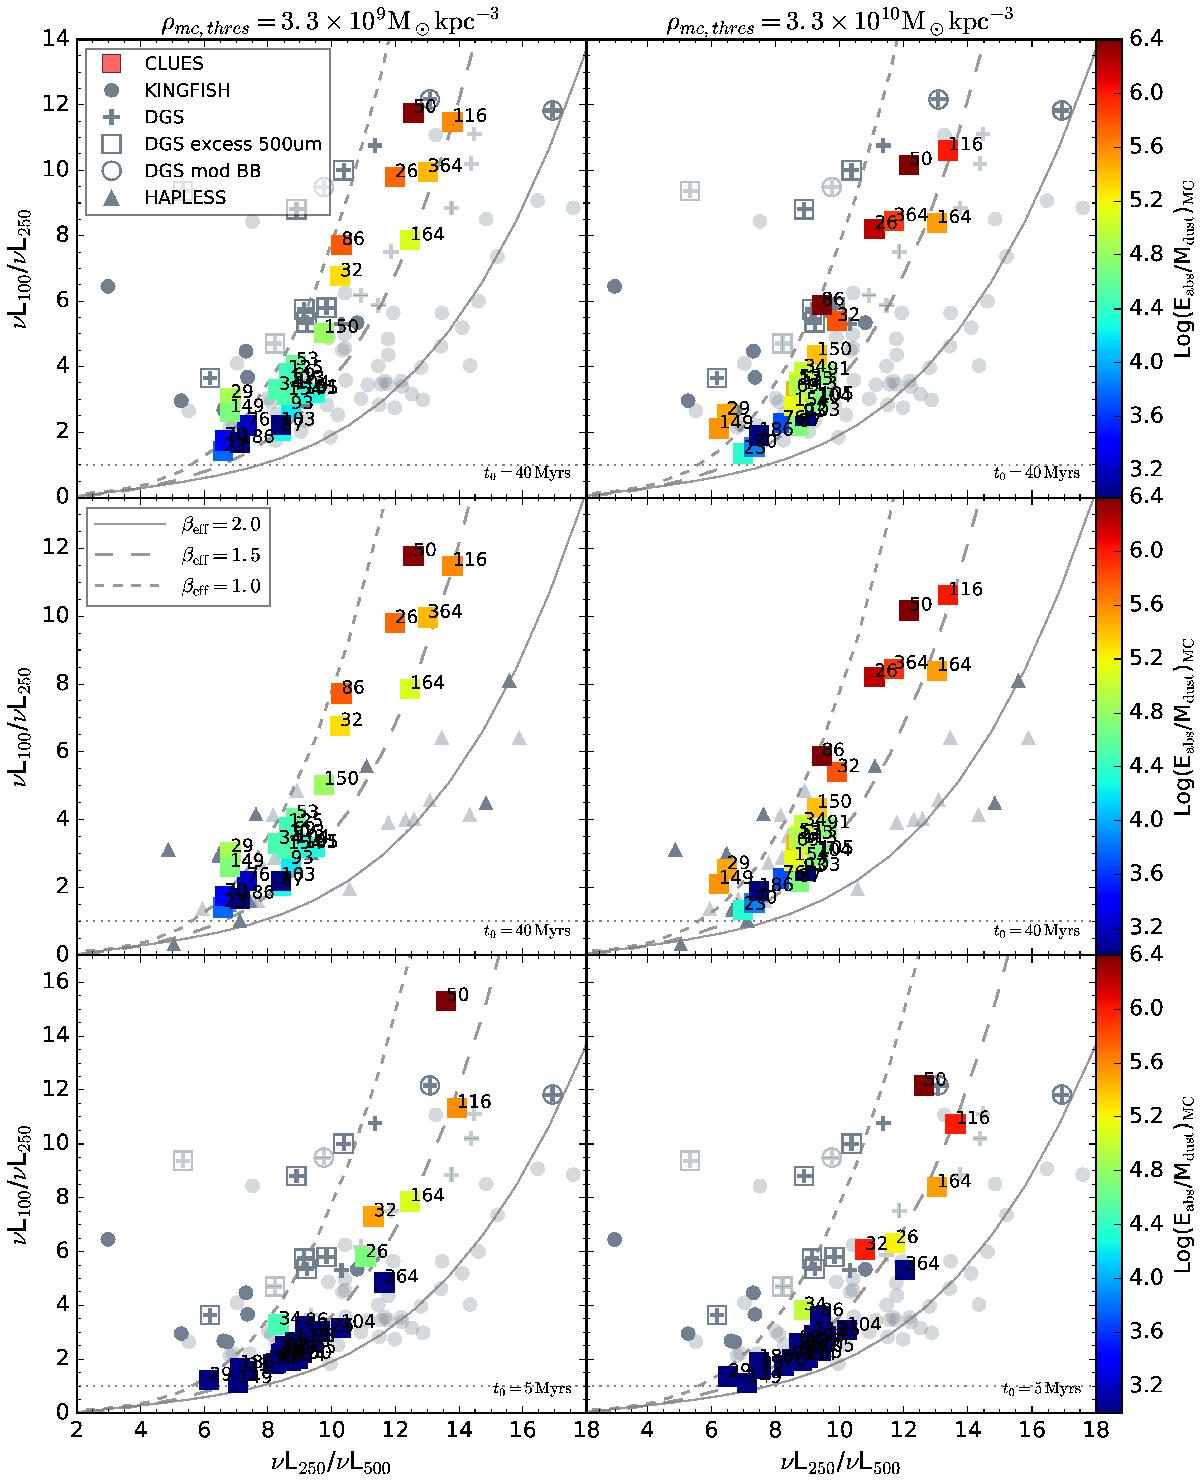
PACS/SPIRE color-color diagram: νL100/νL250 vs. νL250/νL500, which traces the variations of the emissivity index β. Panel distribution, symbols, and color-coding are the same as in Fig. 17. The curves give the theoretical Herschel luminosity ratios for simulated modified black bodies of fixed βeff = 1.0, 1.5, and 2.0 (drawn from Fig. 10 in Rémy-Ruyer et al. 2013).
Current usage metrics show cumulative count of Article Views (full-text article views including HTML views, PDF and ePub downloads, according to the available data) and Abstracts Views on Vision4Press platform.
Data correspond to usage on the plateform after 2015. The current usage metrics is available 48-96 hours after online publication and is updated daily on week days.
Initial download of the metrics may take a while.