Fig. 17
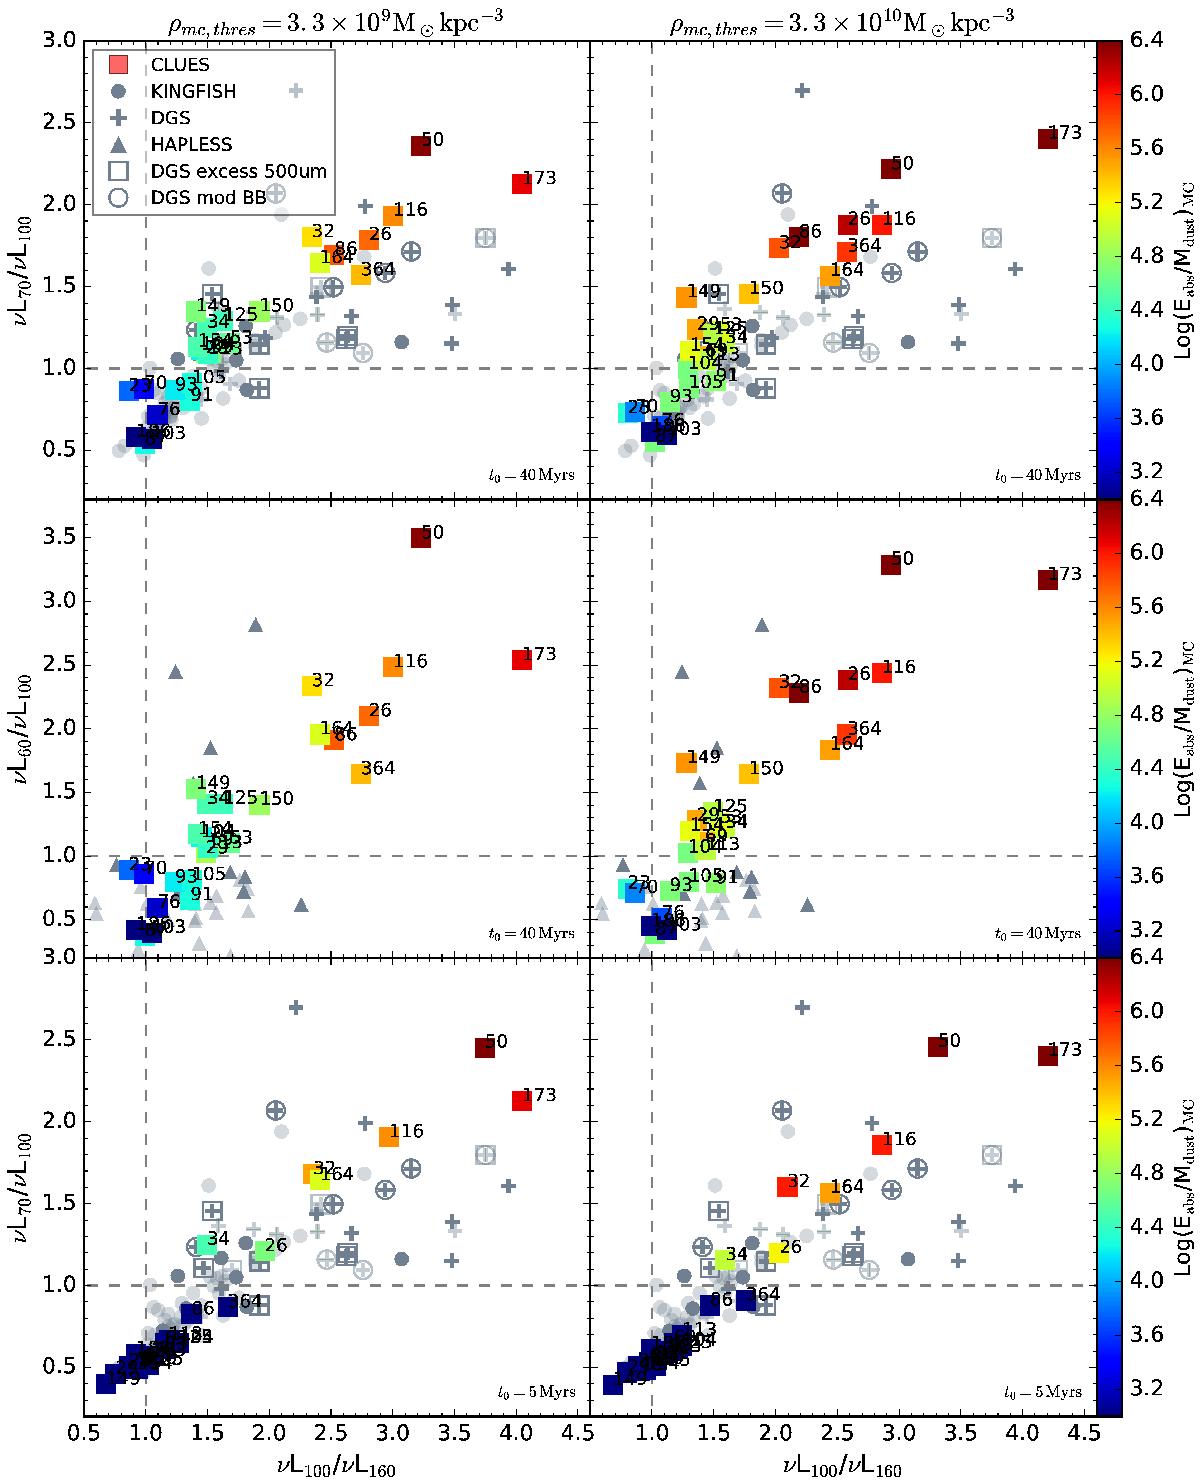
PACS/PACS color-color diagram: νL70/νL100 vs. νL100/νL160, which traces the peak of the SED. CLUES star-forming dwarf galaxies are shown as squares colored by the amount of energy absorbed by molecular clouds per unit dust mass in molecular clouds. Observational data are presented as gray symbols: DGS (crosses), KINGFISH (circles), and HAPLESS (triangles); where faint symbols mark galaxies with Mstar> 109M⊙. DGS galaxies whose SED data were fit in Rémy-Ruyer et al. (2015) with an additional emission component as a MIR modified black body are marked with open circles. DGS galaxies reported in Rémy-Ruyer et al. (2013) to have an excess of emission at 500 μm are marked with open squares. The upper and middle panels show results using a t0 = 40 Myr molecular cloud escape timescale, while in the lower panels t0 = 5 Myr. The left and right columns display the products of adopting a molecular cloud density threshold of ρmc,thres = 3.3 × 10⁹M⊙ kpc-3 and ρmc,thres = 3.3 × 10¹⁰M⊙ kpc-3, respectively. Note that the middle panels show L60 instead of L70.
Current usage metrics show cumulative count of Article Views (full-text article views including HTML views, PDF and ePub downloads, according to the available data) and Abstracts Views on Vision4Press platform.
Data correspond to usage on the plateform after 2015. The current usage metrics is available 48-96 hours after online publication and is updated daily on week days.
Initial download of the metrics may take a while.