Fig. 4
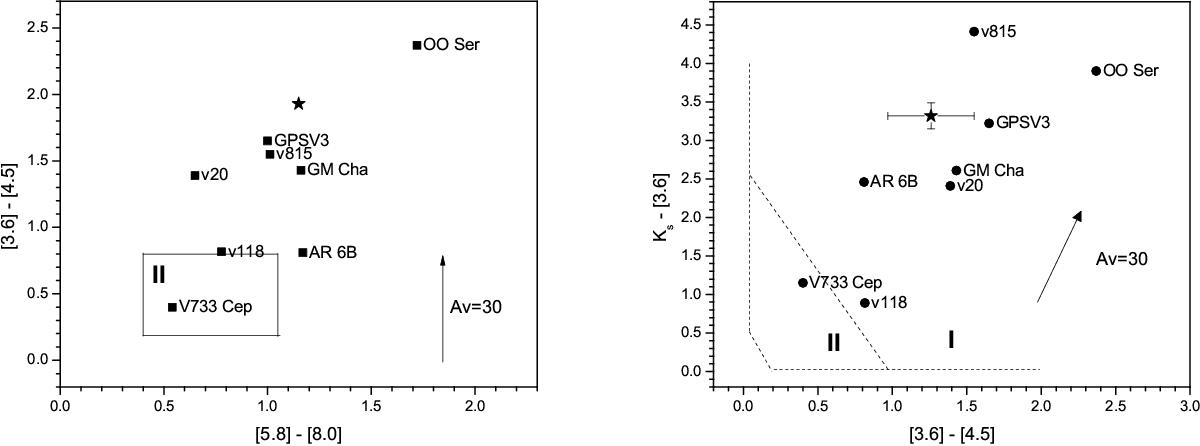
Classification of UKIDSS−J185318.36+012454.5 and other eruptive variables using NIR and MIR measurements. In the left panel, the rectangle marks the domain of Class II sources. The Class I domain is above and to the right (Allen et al. 2004). In the right panel the colors are separated into Class I and II domains by the diagonal dashed line (Gutermuth et al. 2008). Arrows show extinction vectors for AV = 30 (Rieke & Lebofsky 1985; Flaherty et al. 2007). The position of UKIDSS−J185318.36+012454.5 marked by a star. In the right panel the average magnitudes from Tables 1 and 2 are used. The error bars are equal to the standard deviation.
Current usage metrics show cumulative count of Article Views (full-text article views including HTML views, PDF and ePub downloads, according to the available data) and Abstracts Views on Vision4Press platform.
Data correspond to usage on the plateform after 2015. The current usage metrics is available 48-96 hours after online publication and is updated daily on week days.
Initial download of the metrics may take a while.