Free Access
Fig. 3
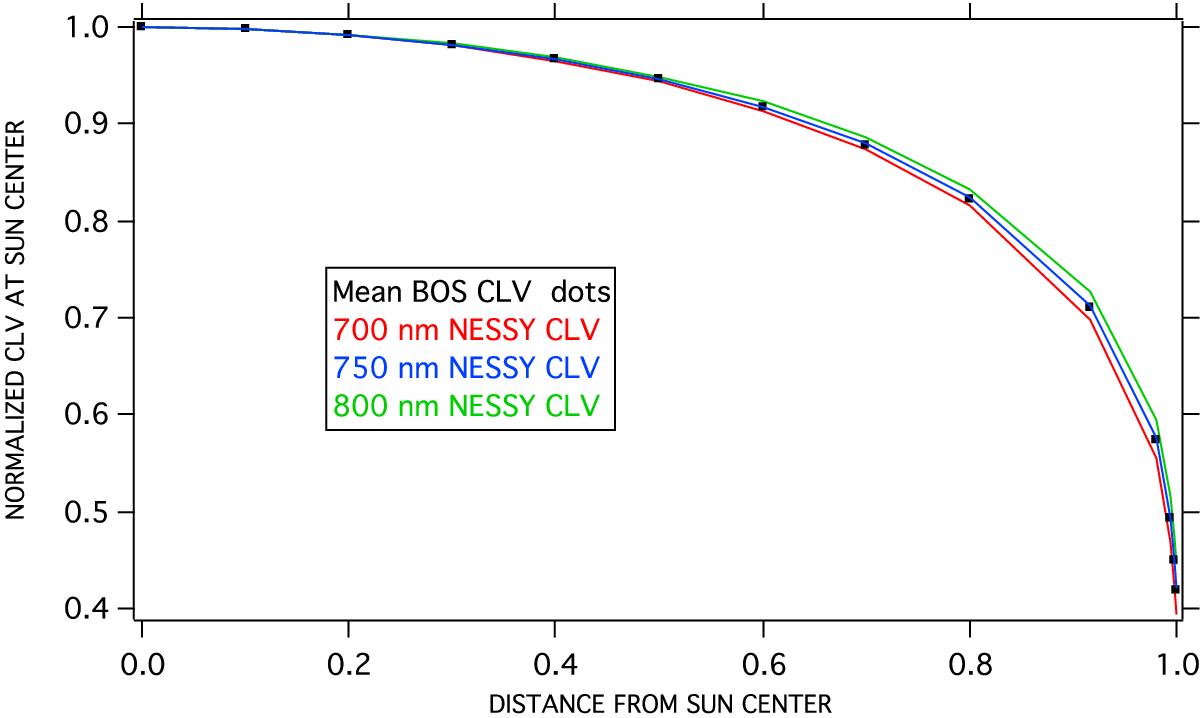
Calculated mean CLVs for the BOS (black dots) compared to CLVs predicted by NESSY at 700 nm (red) and 800 nm (green) located just below and above respectively. This shows that BOS measurements now refer to 750 nm.
Current usage metrics show cumulative count of Article Views (full-text article views including HTML views, PDF and ePub downloads, according to the available data) and Abstracts Views on Vision4Press platform.
Data correspond to usage on the plateform after 2015. The current usage metrics is available 48-96 hours after online publication and is updated daily on week days.
Initial download of the metrics may take a while.