Free Access
Fig. 2
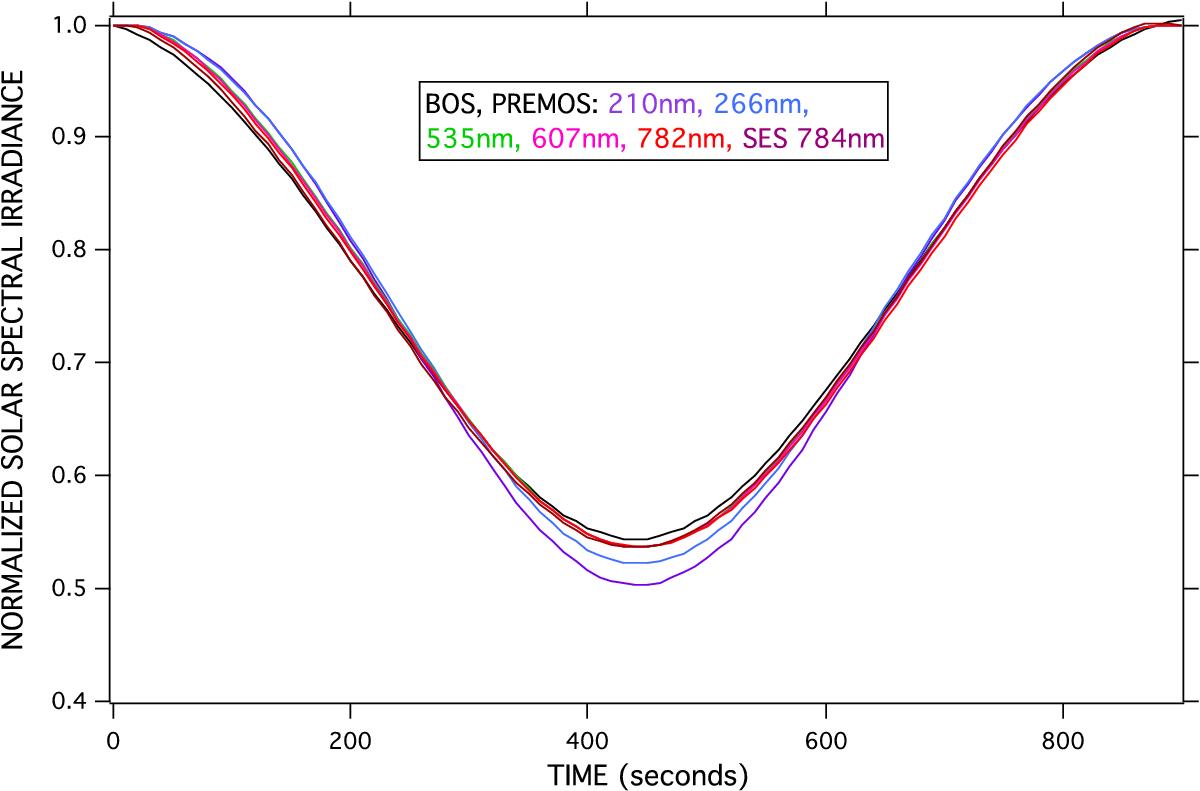
BOS raw data are displayed with PREMOS raw data at 210, 266, 535, 607 and 782 nm together with the SES data for the 1 June 2011 occultation. The 782 nm red line shows the PREMOS data while the thin red line represents the 784 nm Sun sensor (SES) measurements. The difference is within the thickness of the lines.
Current usage metrics show cumulative count of Article Views (full-text article views including HTML views, PDF and ePub downloads, according to the available data) and Abstracts Views on Vision4Press platform.
Data correspond to usage on the plateform after 2015. The current usage metrics is available 48-96 hours after online publication and is updated daily on week days.
Initial download of the metrics may take a while.