Fig. 1
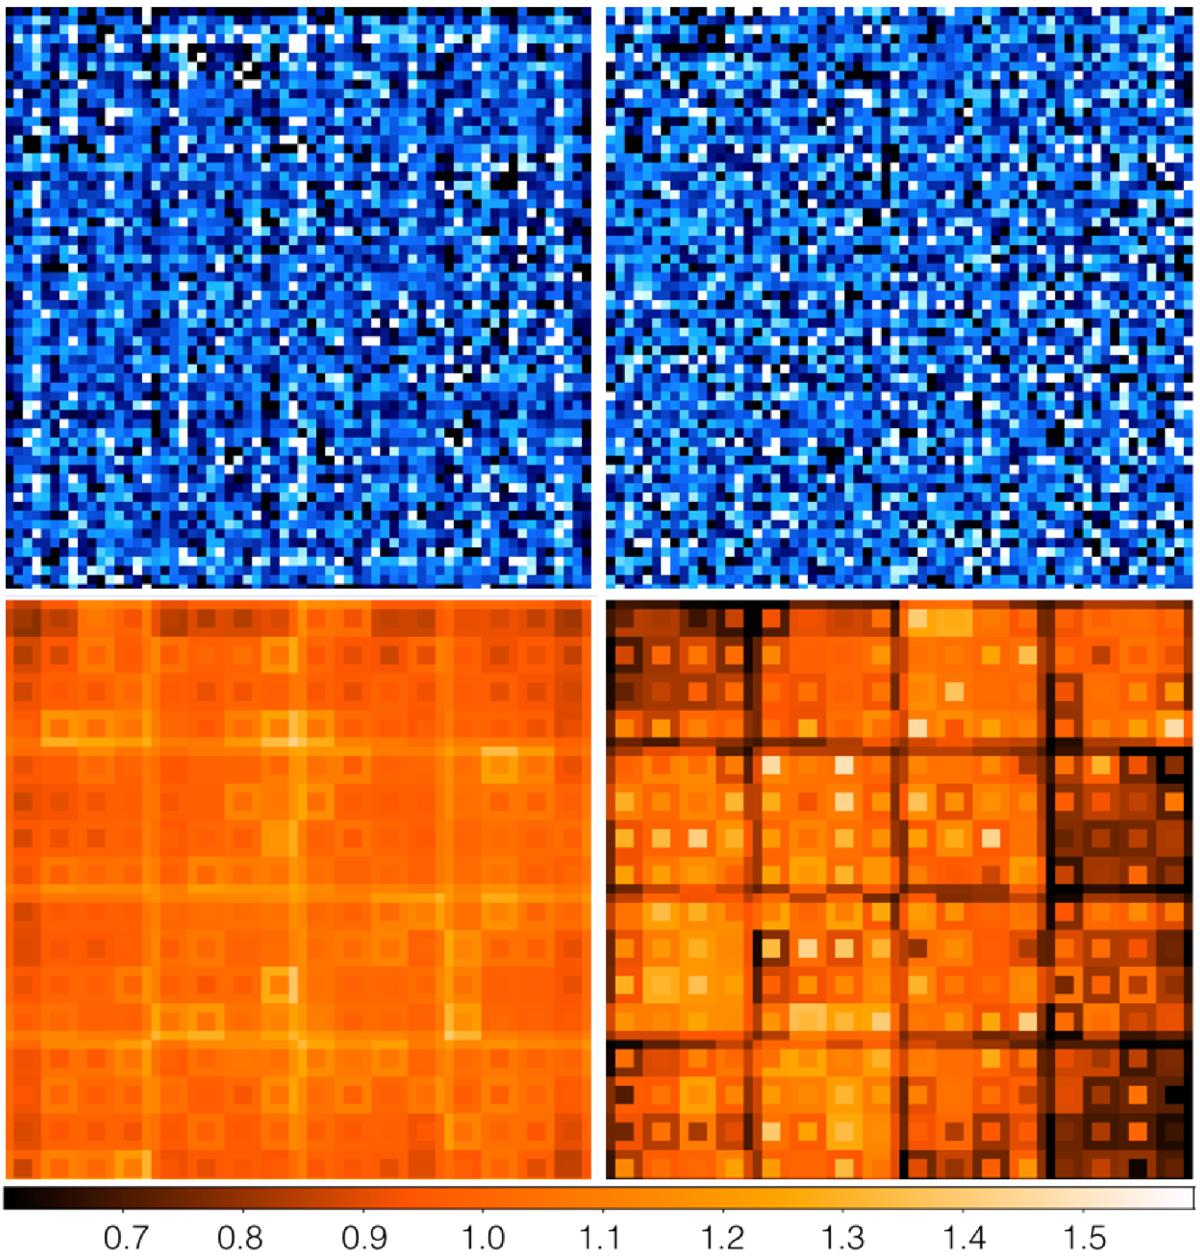
Typical background (first row) and uniformity (second row) maps obtained for single (left) and multiple (right) events in the energy band 336–448 keV. The colour scale is indicated for the uniformity maps. The colour bars of the background maps were chosen to distinguish 90% of the events. The background maps are rescaled during the analysis to match the exposure of each pointing.
Current usage metrics show cumulative count of Article Views (full-text article views including HTML views, PDF and ePub downloads, according to the available data) and Abstracts Views on Vision4Press platform.
Data correspond to usage on the plateform after 2015. The current usage metrics is available 48-96 hours after online publication and is updated daily on week days.
Initial download of the metrics may take a while.