Fig. 2
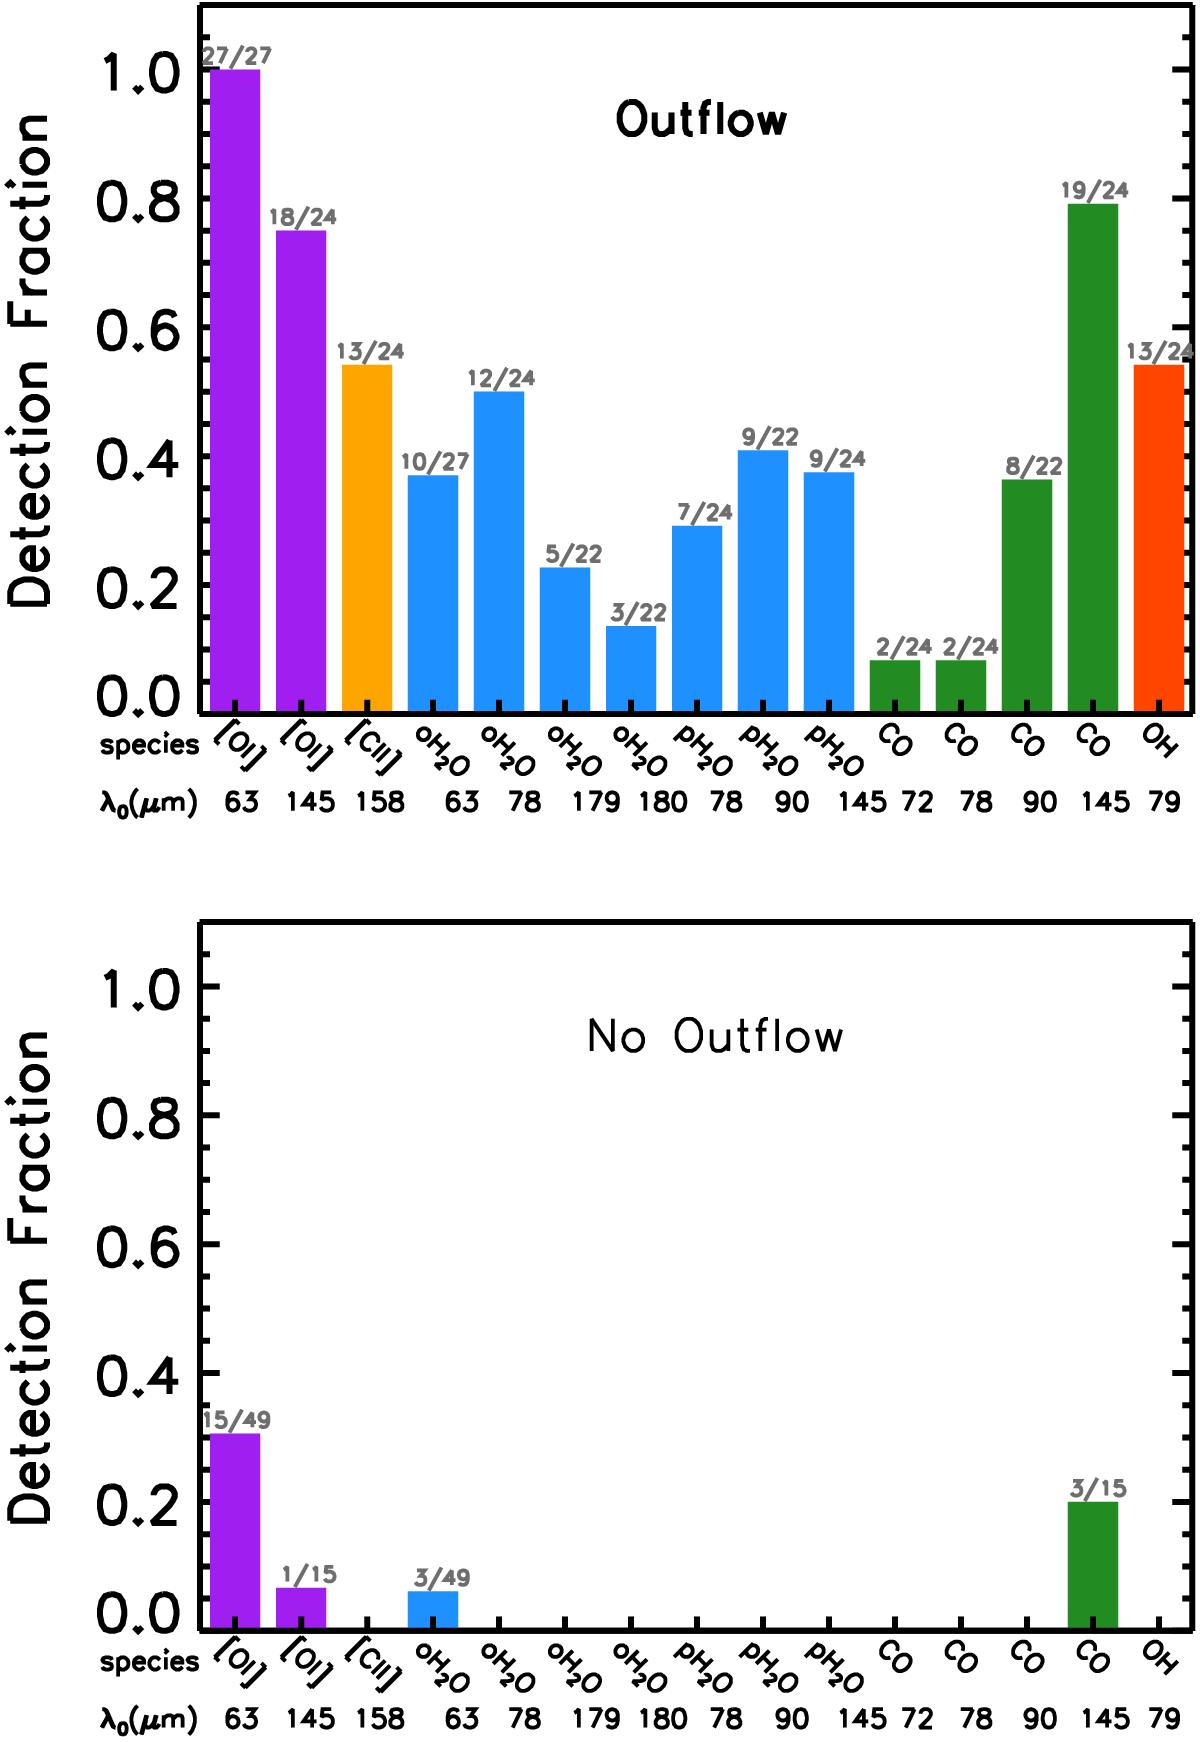
Line emission detection fractions for the different species observed within PACS range. Objects with (top) and without (bottom) an outflow. Each species has a different colour: [OI] (purple), [CII] (yellow), H2O (blue), CO (green), and OH (red). The numbers on top of the bars refer to the total detections over the total targets observed. The atomic/molecular species and central wavelengths for the transitions are also indicated.
Current usage metrics show cumulative count of Article Views (full-text article views including HTML views, PDF and ePub downloads, according to the available data) and Abstracts Views on Vision4Press platform.
Data correspond to usage on the plateform after 2015. The current usage metrics is available 48-96 hours after online publication and is updated daily on week days.
Initial download of the metrics may take a while.