Free Access
Fig. E.1
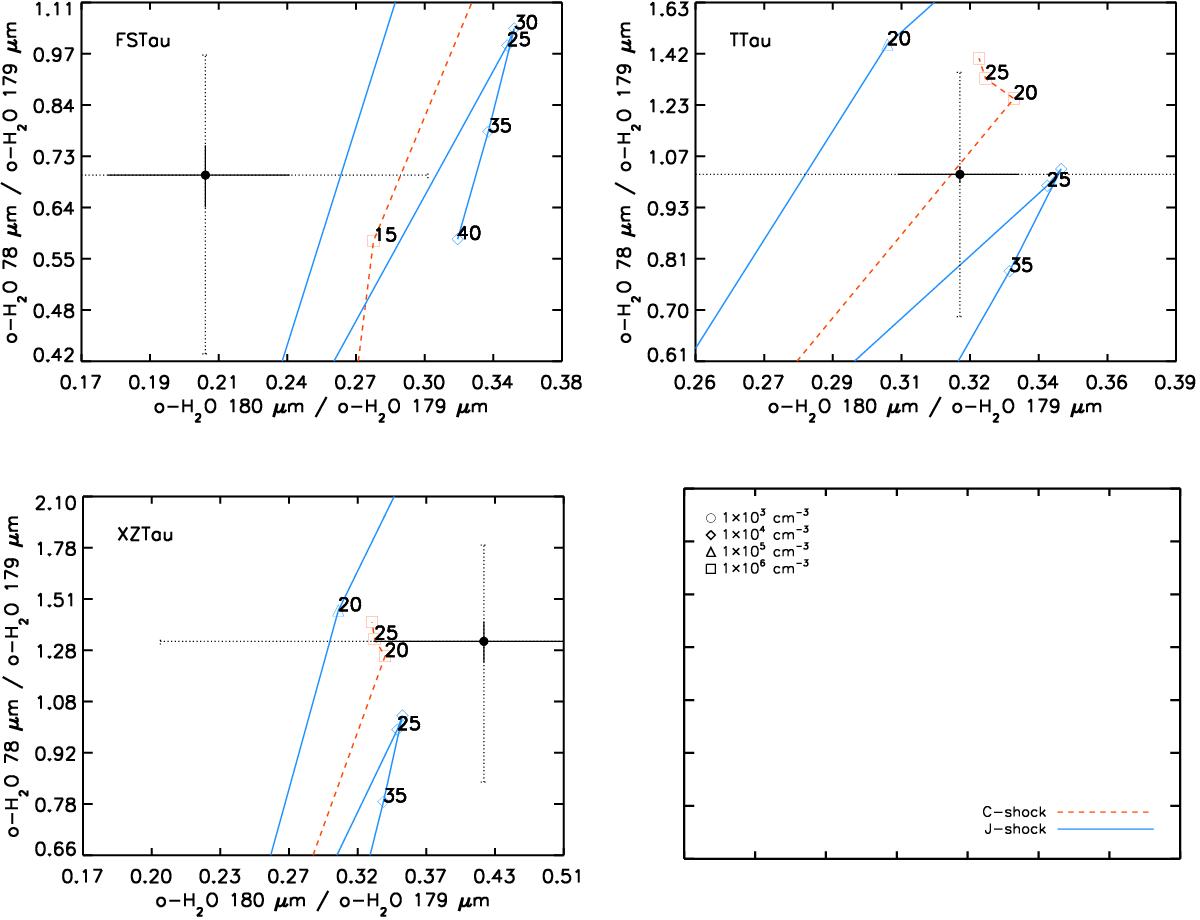
Detail of the observed o-H2O molecular line ratios (78/179 and 180/179) compared to J-type (blue) and C-type (red) shock models from Flower & Pineau des Forêts (2015) for individual sources. The numbers refer to shock velocities (Vshock). Different symbols refer to pre-shock densities (n). See legend for details.
This figure is made of several images, please see below:
Current usage metrics show cumulative count of Article Views (full-text article views including HTML views, PDF and ePub downloads, according to the available data) and Abstracts Views on Vision4Press platform.
Data correspond to usage on the plateform after 2015. The current usage metrics is available 48-96 hours after online publication and is updated daily on week days.
Initial download of the metrics may take a while.