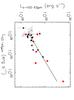
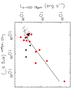
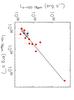
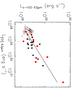
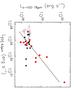
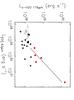
Fig. 11
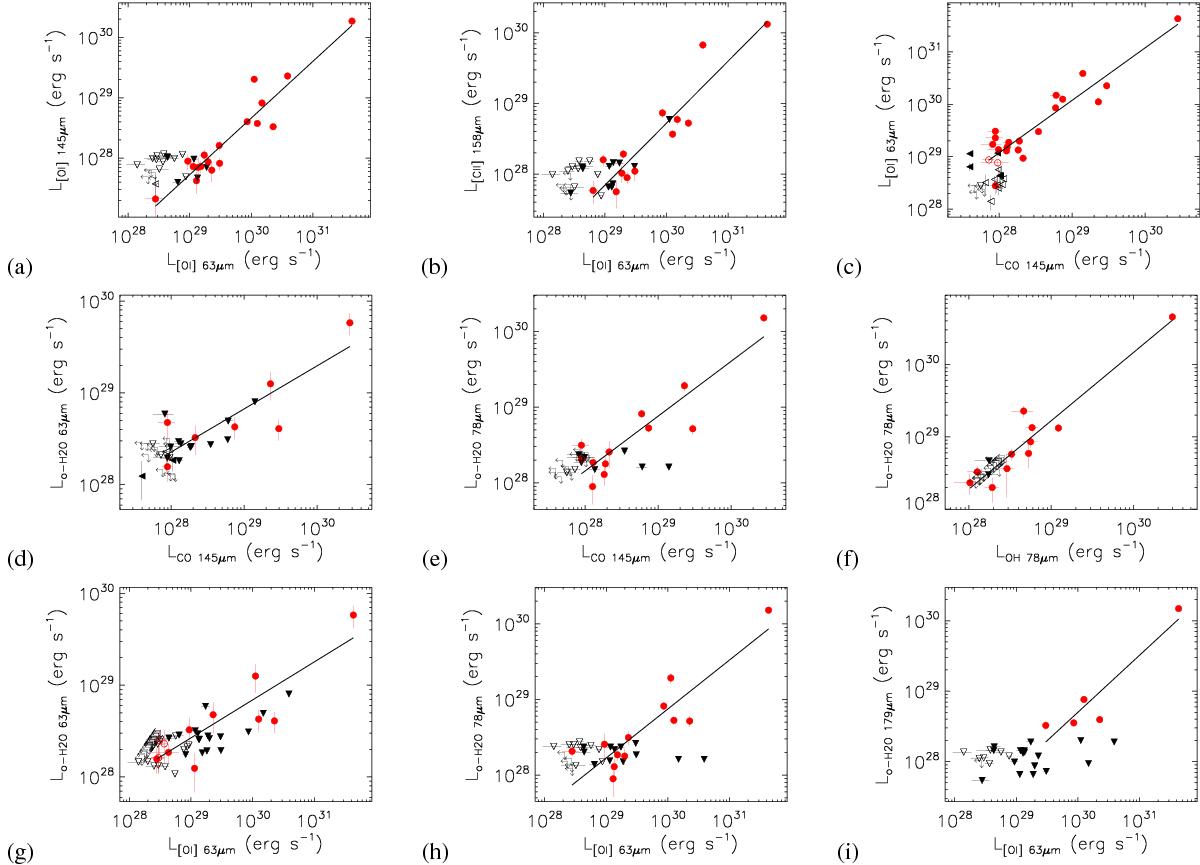
Correlation plots between: a) [OI] 63.18 μm and [OI] 145.52 μm; b) [OI] 63.18 μm and [CII] 157.74 μm (see Howard et al. 2013); c) [OI] 63.18 μm and CO 144.78 μm; d) CO 144.78 μm and o-H2O 63.32 μm; e) CO 144.78 μm and o-H2O 78.74 μm; f) OH 79.12+79.18 μm and o-H2O 78.74 μm; g) [OI] 63.18 μm and o-H2O 63.32 μm (see Riviere-Marichalar et al. 2012); h) [OI] 63.18 μm and o-H2O 78.74 μm; and i) [OI] 63.18 μm and o-H2O 179.53 μm (tentatively). The red circles represent detections, grey triangles are upper limits in their pointing direction, and black arrows are upper limits in both axes. Filled symbols represent outflow sources. The solid line corresponds to a linear fit for detections.
Current usage metrics show cumulative count of Article Views (full-text article views including HTML views, PDF and ePub downloads, according to the available data) and Abstracts Views on Vision4Press platform.
Data correspond to usage on the plateform after 2015. The current usage metrics is available 48-96 hours after online publication and is updated daily on week days.
Initial download of the metrics may take a while.