Fig. 1
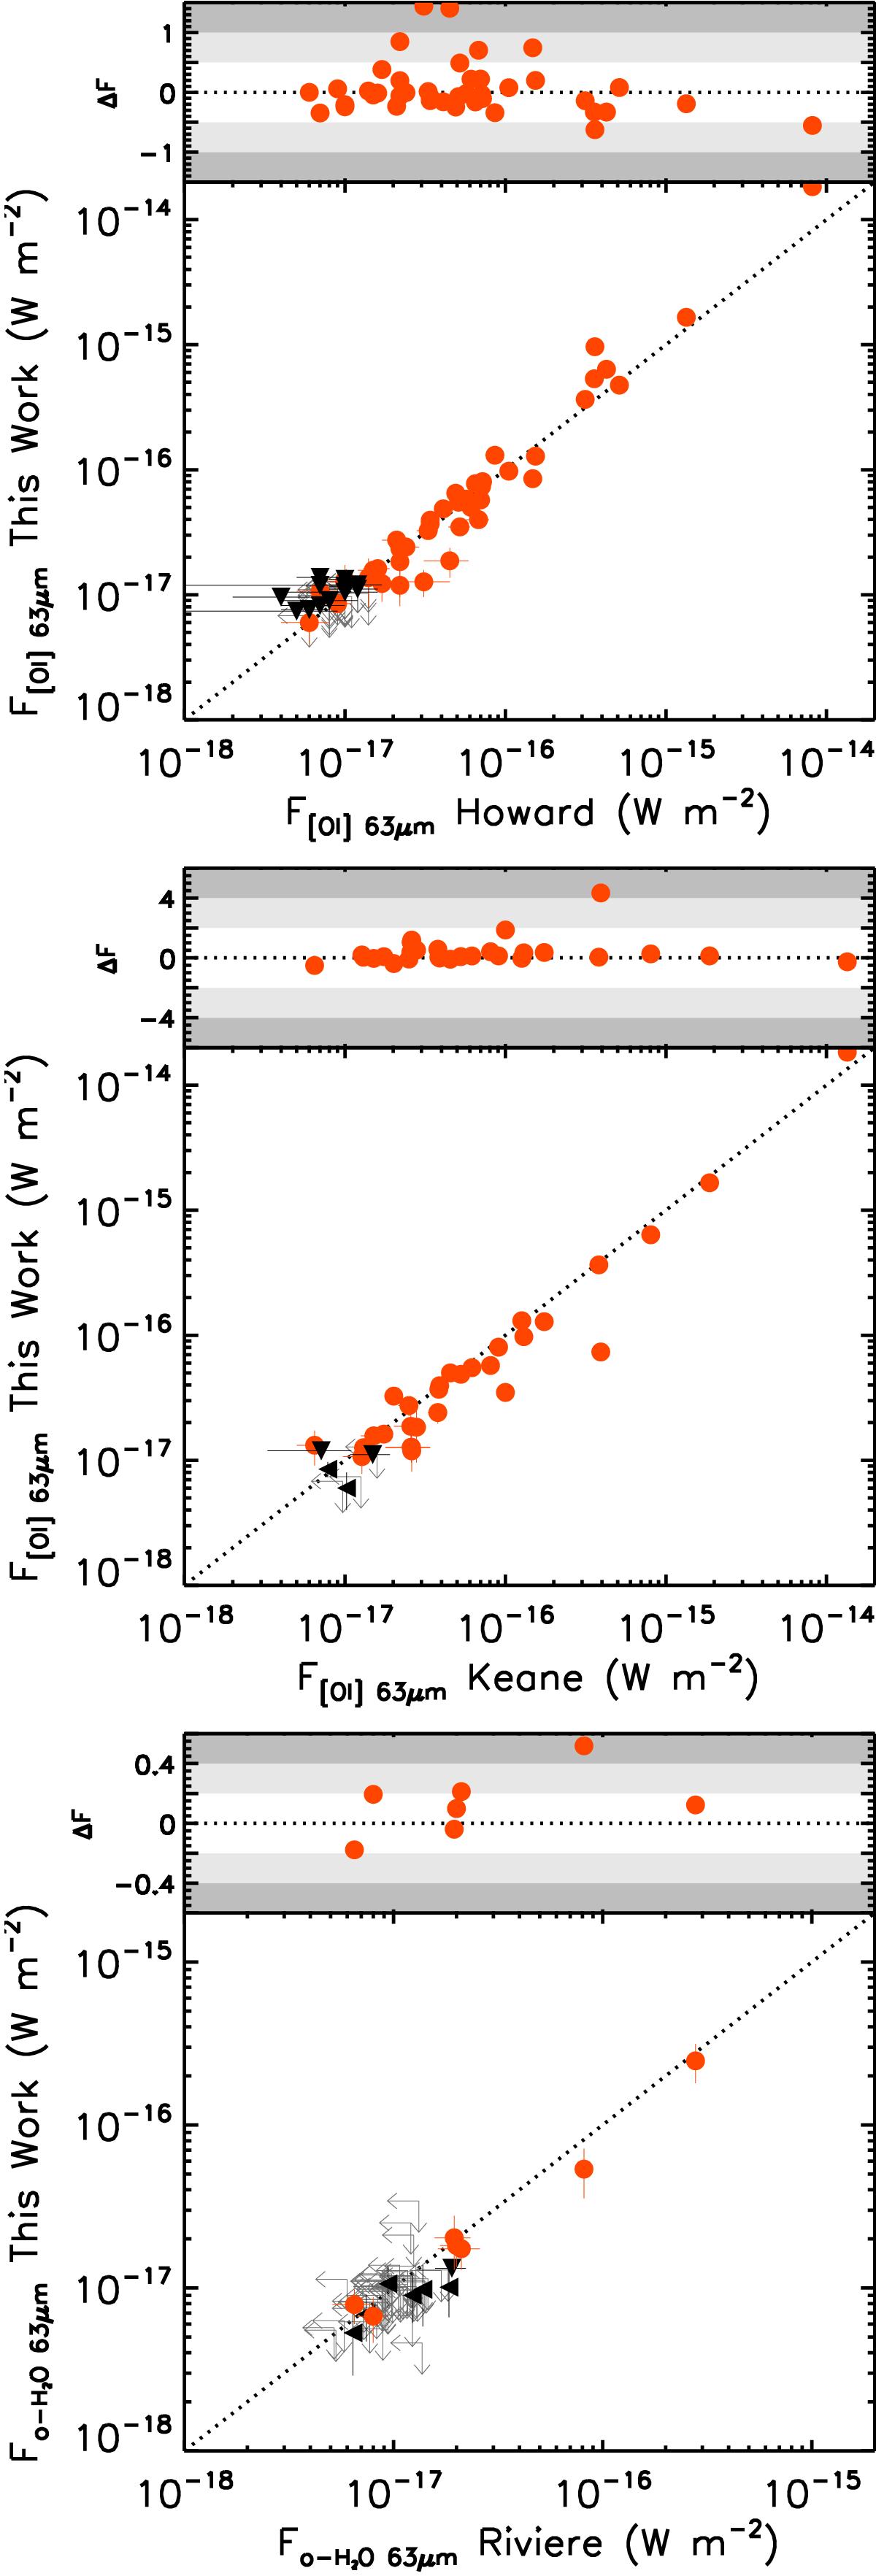
Comparison of our [OI] 63.18 μm fluxes with those in Howard et al. (2013; top) and Keane et al. (2014; middle), and comparison of o-H2O 63.32 μm fluxes with those in Riviere-Marichalar et al. (2012; bottom). In all the panels the red circles represent the detections, while black down-facing and left-facing triangles are upper limits in the y-axis and x-axis, respectively. Arrows represent upper limits in both axes. ΔF (![]() ) is the fractional difference between the two sets of measurements.
) is the fractional difference between the two sets of measurements.
Current usage metrics show cumulative count of Article Views (full-text article views including HTML views, PDF and ePub downloads, according to the available data) and Abstracts Views on Vision4Press platform.
Data correspond to usage on the plateform after 2015. The current usage metrics is available 48-96 hours after online publication and is updated daily on week days.
Initial download of the metrics may take a while.