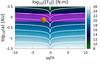
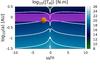
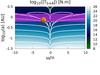
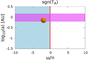
Fig. 3

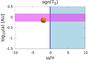
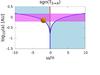
Top: solid (left panel), atmospheric (middle panel) and total tidal torque (right panel) exerted on a Venus-like planet as functions of the reduced forcing frequency ω/n (horizontal axis) and orbital radius a in logarithmic scale (vertical axis). The colour level corresponds to the torque in logarithmic scale with isolines at ![]() . Bottom: sign of the solid (left panel), atmospheric (middle panel) and total (right panel) tidal torque as functions of the same parameters: white (blue) areas are associated with positive (negative) torques. Stable (unstable) states of equilibrium are designated by blue (red) lines (with A = 1.88 × 10¹⁹ m s). The pink band corresponds to the habitable zone for the black body equilibrium temperature Teq = 288 K ± 20% for a 1 M⊙ Solar-type star at the age of the Sun.
. Bottom: sign of the solid (left panel), atmospheric (middle panel) and total (right panel) tidal torque as functions of the same parameters: white (blue) areas are associated with positive (negative) torques. Stable (unstable) states of equilibrium are designated by blue (red) lines (with A = 1.88 × 10¹⁹ m s). The pink band corresponds to the habitable zone for the black body equilibrium temperature Teq = 288 K ± 20% for a 1 M⊙ Solar-type star at the age of the Sun.
Current usage metrics show cumulative count of Article Views (full-text article views including HTML views, PDF and ePub downloads, according to the available data) and Abstracts Views on Vision4Press platform.
Data correspond to usage on the plateform after 2015. The current usage metrics is available 48-96 hours after online publication and is updated daily on week days.
Initial download of the metrics may take a while.