Fig. 6
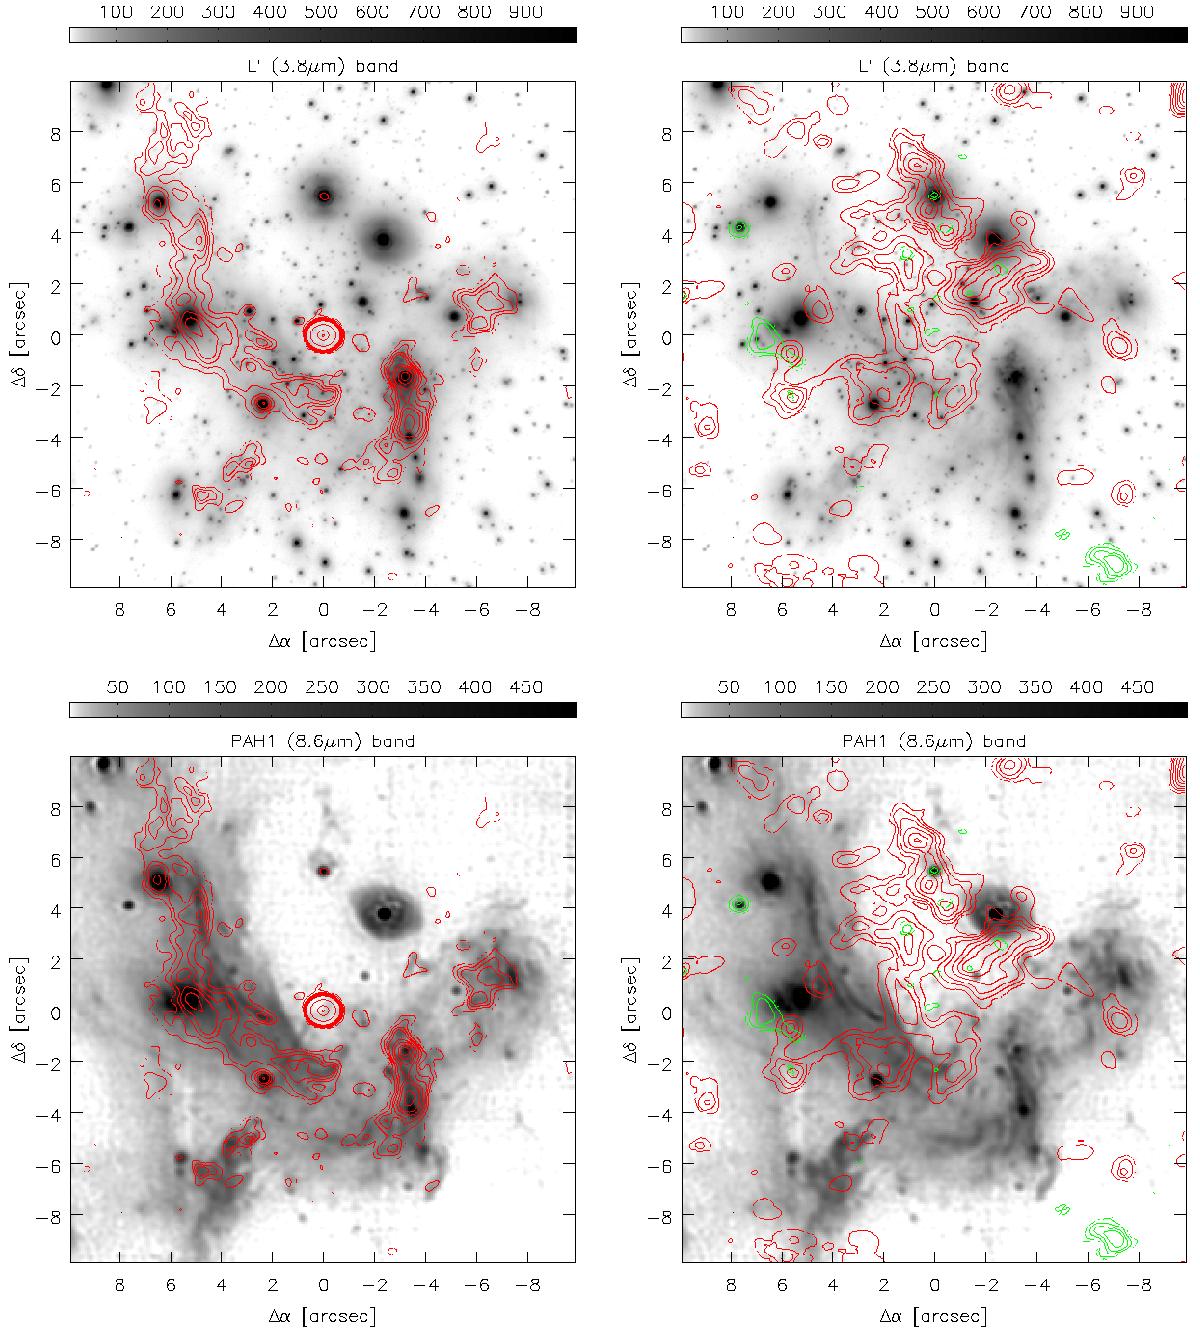
Molecular gas and continuum emission maps in the inner 20′′ compared to the NIR VLT/NACO L’ (3.8 μm) emission (top, Sabha, priv. comm.) and the MIR VLT/VISIR PAH (8.6 μm) emission images (bottom, Sabha et al., in prep.) in arbitrary units. The left side shows the 340 GHz continuum in red contours of [6, 12, 18, 24, 36, 48, 72, 96, 960, 9600, 17 280] ×σ (=0.24 mJy beam-1). The right side shows CS(5–4) in red contours as in Fig. 5 and SiO(6–5) in green contours of [2, 4, 8, 12, 16] ×σ (=0.08 Jy beam-1 km s-1).
Current usage metrics show cumulative count of Article Views (full-text article views including HTML views, PDF and ePub downloads, according to the available data) and Abstracts Views on Vision4Press platform.
Data correspond to usage on the plateform after 2015. The current usage metrics is available 48-96 hours after online publication and is updated daily on week days.
Initial download of the metrics may take a while.