Fig. 5
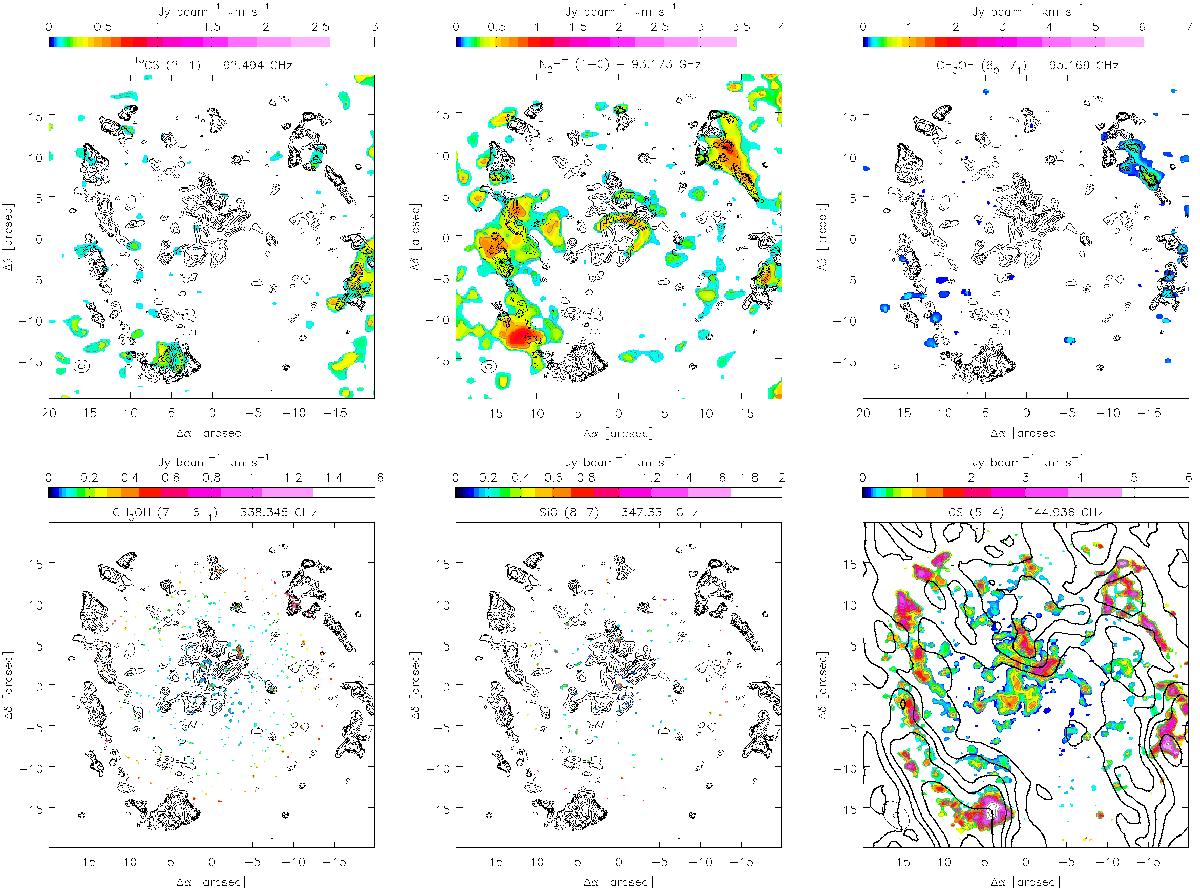
continued. Molecular line emission images of the inner 40′′ (1.6 pc) at a resolution of about 0.7′′× 0.6′′. Top row (from left to right): 13CS(2–1), N2H+(1–0), and CH3OH(8–7) as in Fig. 4, but zoomed in. Bottom row (from left to right): CH3OH(7–6) and SiO(8–7), both at resolutions of 0.5′′× 0.5′′, and CS(5–4) as before. The contours show the CS(5–4) emission at the levels of [4, 8, 12, 18, 24, 30, 36, 48, 60, 72, 84] ×σ (=0.08 Jy beam-1 km s-1) for comparison. except from bottom right image, which is overlayed with the CN(2–1) emission as in Fig. 4. The inner rim of the CND is detected (cf. Fig. 1) toward the edge of the FOV10 of the band 6 and 7 emission lines.
Current usage metrics show cumulative count of Article Views (full-text article views including HTML views, PDF and ePub downloads, according to the available data) and Abstracts Views on Vision4Press platform.
Data correspond to usage on the plateform after 2015. The current usage metrics is available 48-96 hours after online publication and is updated daily on week days.
Initial download of the metrics may take a while.