Fig. 5
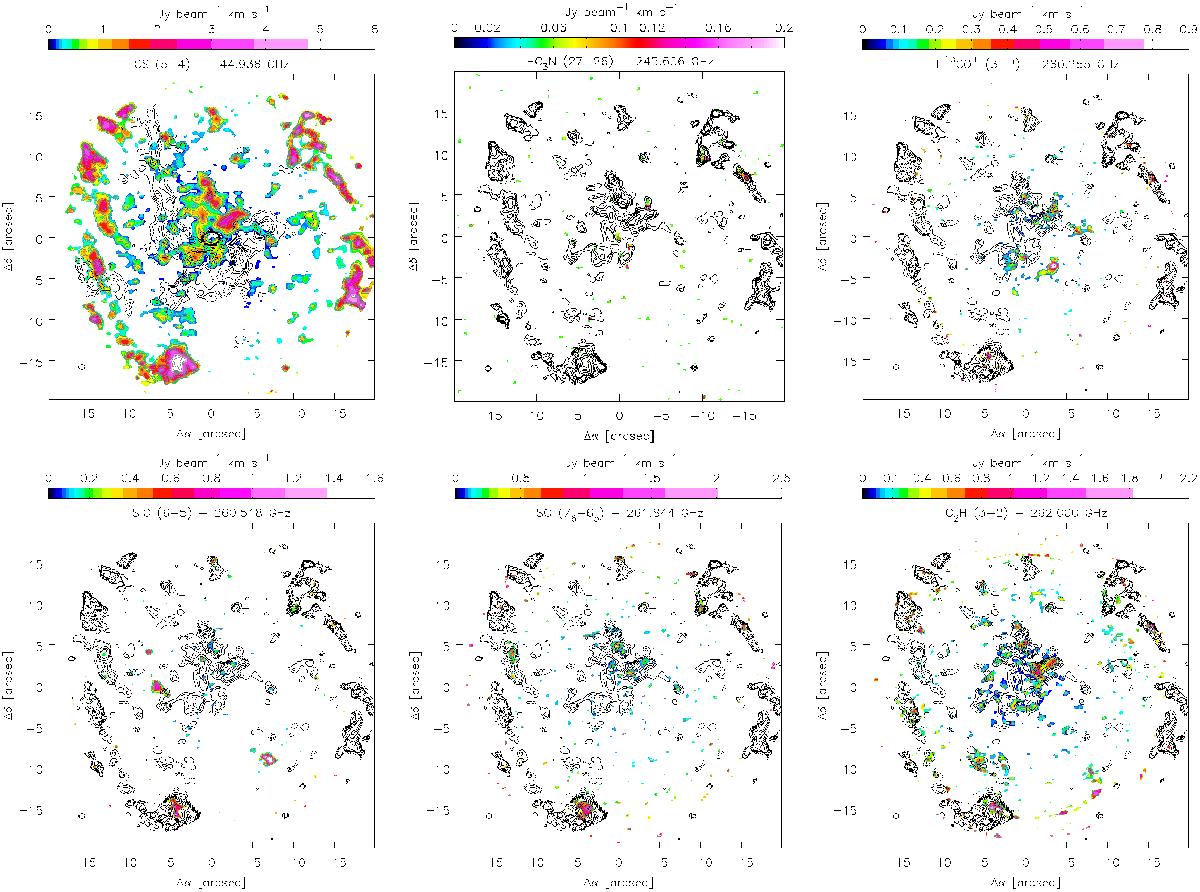
Molecular line emission images of the inner 40′′ (1.6 pc) at a resolution of about 0.7′′× 0.6′′. Top row (from left to right): CS(5–4), with 250 GHz contours as in Fig. 2, HC3N(27–26), and H13CO+(3–2). Bottom row (from left to right): SiO(6–5), SO(7–6), and C2H(3–2). The contours show the CS(5–4) emission at the levels of [4, 8, 12, 18, 24, 30, 36, 48, 60, 72, 84] ×σ (=0.08 Jy beam-1 km s-1) for comparison (see also Fig. A.4). Zooms into the inner 20′′, the triop (15′′ northwest of Sgr A*), and the SEW clumps (15′′ south(east) of Sgr A*) can be found in Figs. A.8 and A.7, A.5, and A.6, respectively.
Current usage metrics show cumulative count of Article Views (full-text article views including HTML views, PDF and ePub downloads, according to the available data) and Abstracts Views on Vision4Press platform.
Data correspond to usage on the plateform after 2015. The current usage metrics is available 48-96 hours after online publication and is updated daily on week days.
Initial download of the metrics may take a while.