Fig. A.6
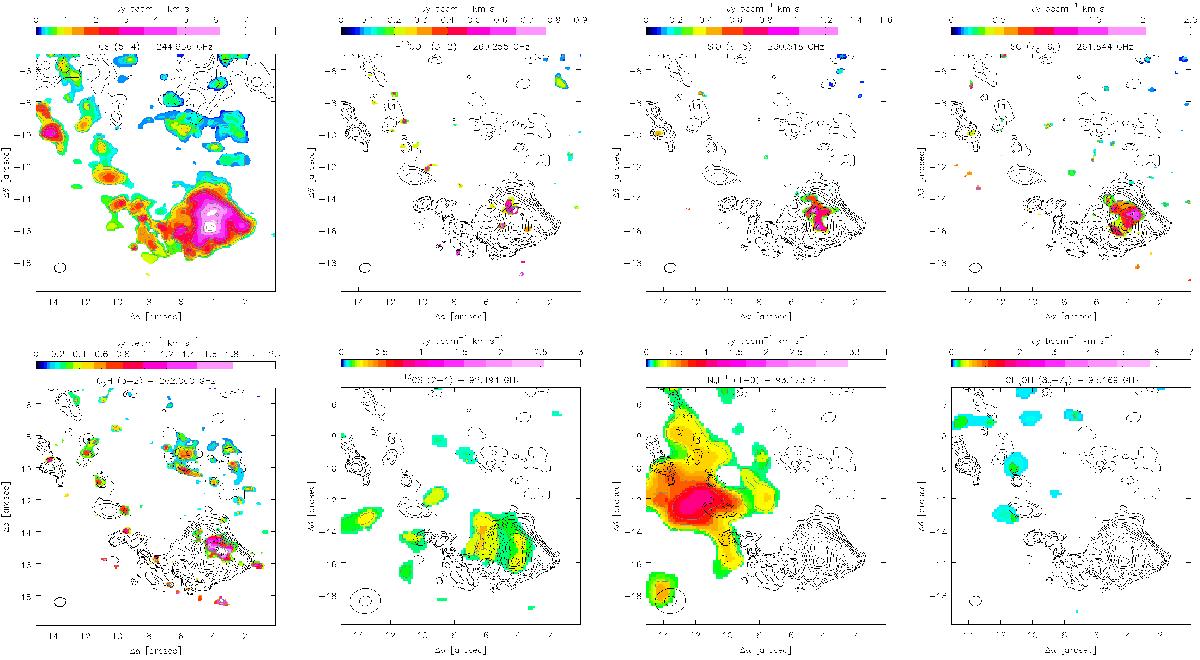
SEW cloud in the light of molecular line and continuum emission. Top row (from left to right): CS(5–4), H13CO+(3–2), SiO(6–5), and SO(7–6) (all as in Fig. 5). Bottom – from left to right: C2H(3–2) (as in Fig. 5), and 13CS(2–1), N2H+(1–0), and CH3OH(8–7) (all three as in Fig. 4). Contours show the CS(5–4) emission (as in Fig. 5), except from the top outer left, which shows contours of the 250 GHz continuum emission as in Fig. 2.
Current usage metrics show cumulative count of Article Views (full-text article views including HTML views, PDF and ePub downloads, according to the available data) and Abstracts Views on Vision4Press platform.
Data correspond to usage on the plateform after 2015. The current usage metrics is available 48-96 hours after online publication and is updated daily on week days.
Initial download of the metrics may take a while.