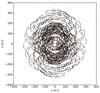
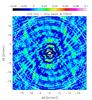
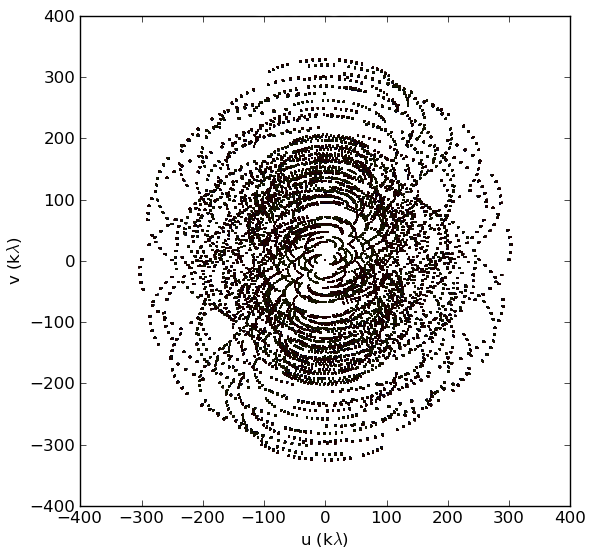
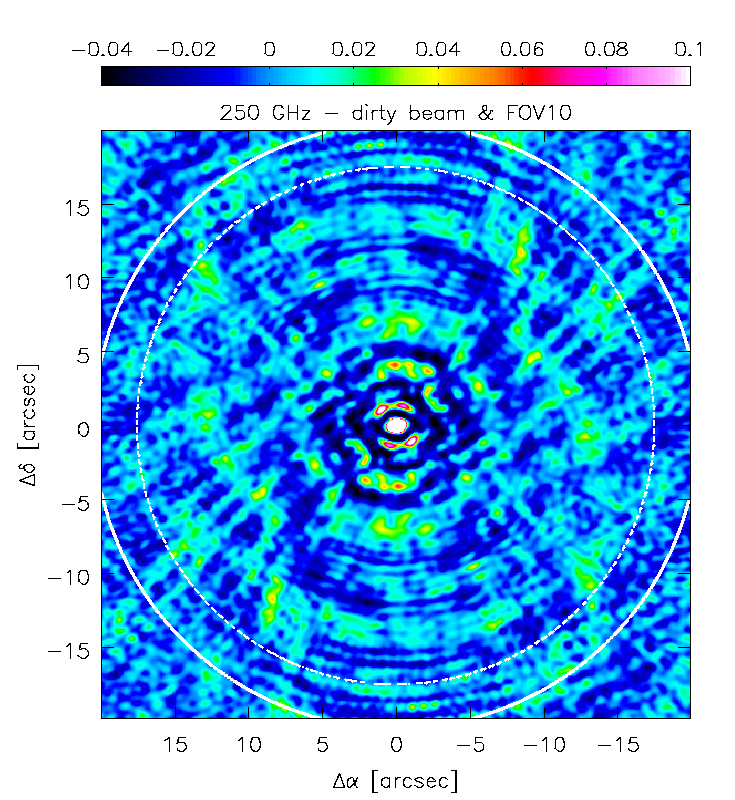
Fig. A.1

Left: uv coverage in a single channel at 250 GHz. Right: dirty beam for the 250 GHz continuum. Color scale shows the intensity or sensitivity normalized to 1.0 and is clipped to 0.1 to show the side lobe structure. First side lobe maximum and minimum are at 0.12 and –0.05, respectively, and located in the inner 5′′. White contour outline the CS(5–4) (solid) and 250 GHz continuum (dashed) primary beam at 10% sensitivity (FOV10).
Current usage metrics show cumulative count of Article Views (full-text article views including HTML views, PDF and ePub downloads, according to the available data) and Abstracts Views on Vision4Press platform.
Data correspond to usage on the plateform after 2015. The current usage metrics is available 48-96 hours after online publication and is updated daily on week days.
Initial download of the metrics may take a while.