Fig. 12
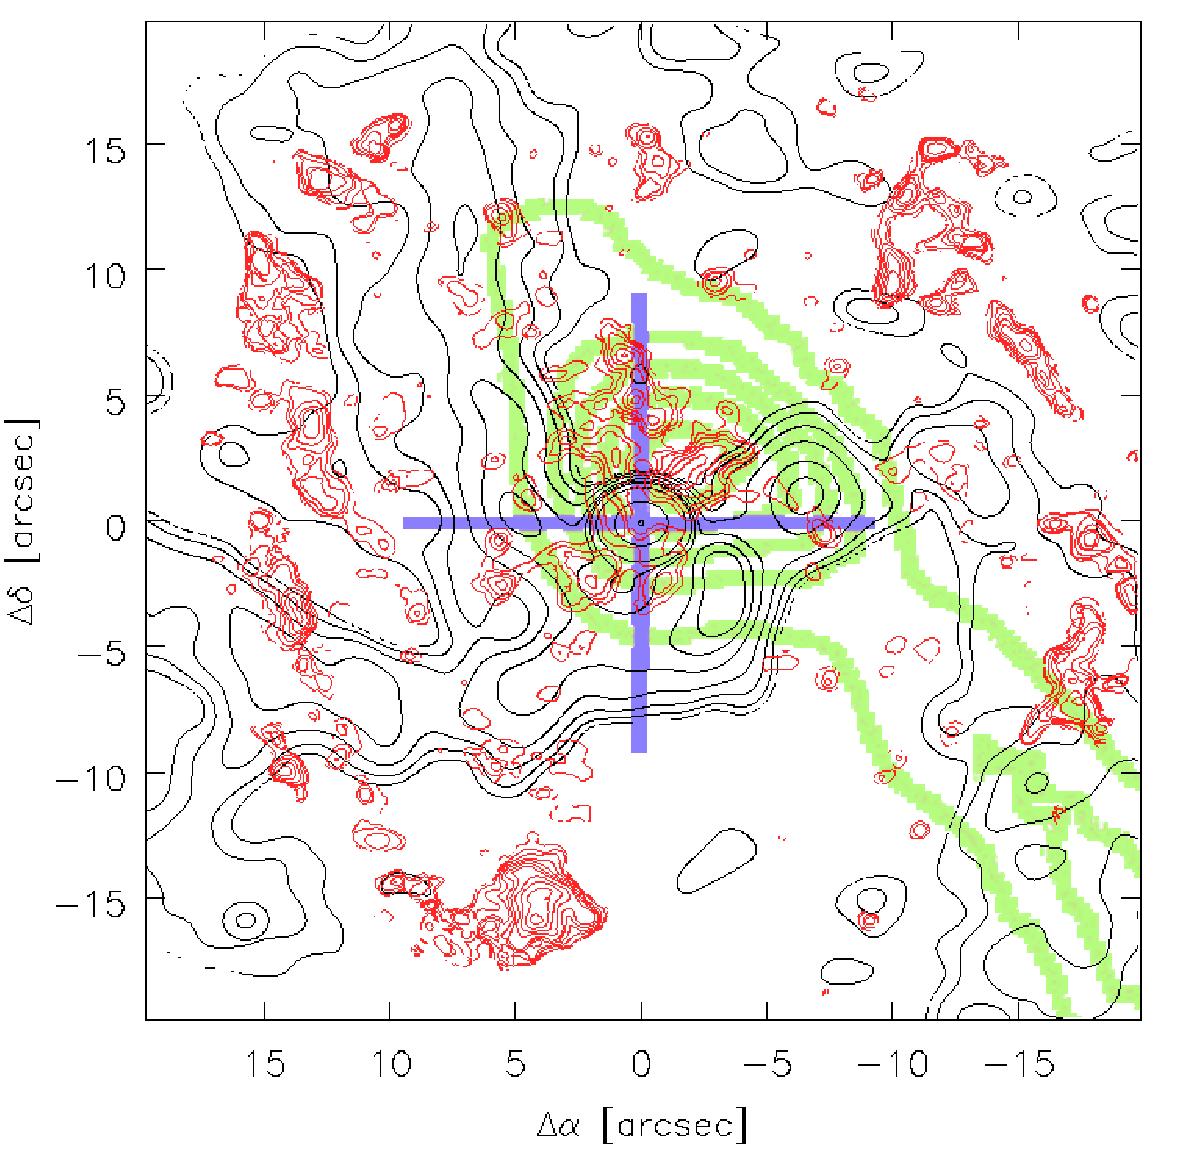
Schematic view on the OH streamer in OH emission at 50 km s-1 in green contours with lowest level at ~90 mJy beam-1 (~3.5σ) and steps of 1σ from Karlsson et al. (2015). Black contours show the 100 GHz continuum emission as in Fig. 2, red contours indicate the CS(5–4) emission as in Fig. 5, and the blue cross indicates Sgr A*. The shape of the streamer head resembles the distribution of the CS clumps.
Current usage metrics show cumulative count of Article Views (full-text article views including HTML views, PDF and ePub downloads, according to the available data) and Abstracts Views on Vision4Press platform.
Data correspond to usage on the plateform after 2015. The current usage metrics is available 48-96 hours after online publication and is updated daily on week days.
Initial download of the metrics may take a while.