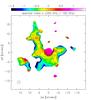
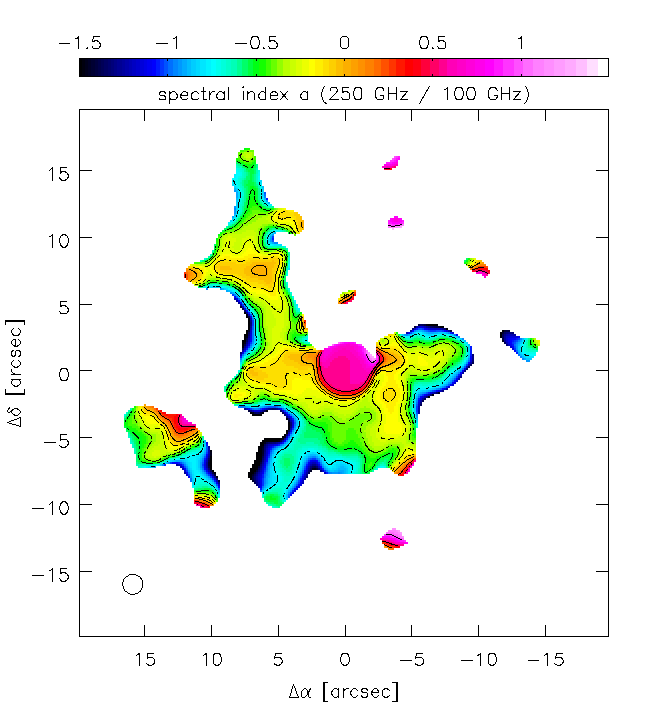
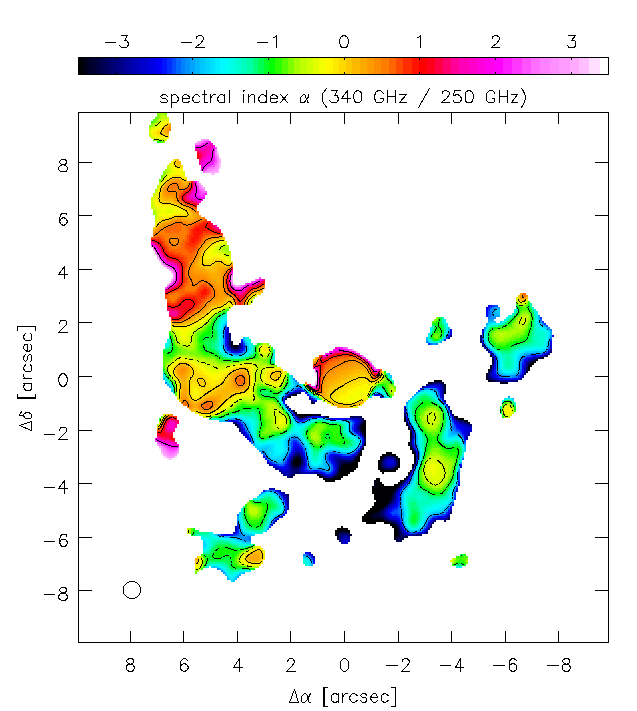
Fig. 8

Continuum spectral index distribution in the inner ≲1.6 pc. Top: between 100 and 250 GHz (inner 40′′) tapered to a resolution of 1.5′′ with contours of [–0.75, –0.5, –0.375, –0.25, –0.125, 0, 0.25, 0.5, 1, 1.5]. Bottom: between 250 and 340 GHz (inner 20′′) tapered to a resolution of 0.65′′ with contours of [–2, –1, –0.5, 0, 0.5, 1, 2]. Maps on the uncertainties can be found in Fig. A.10.

Current usage metrics show cumulative count of Article Views (full-text article views including HTML views, PDF and ePub downloads, according to the available data) and Abstracts Views on Vision4Press platform.
Data correspond to usage on the plateform after 2015. The current usage metrics is available 48-96 hours after online publication and is updated daily on week days.
Initial download of the metrics may take a while.