Fig. 8
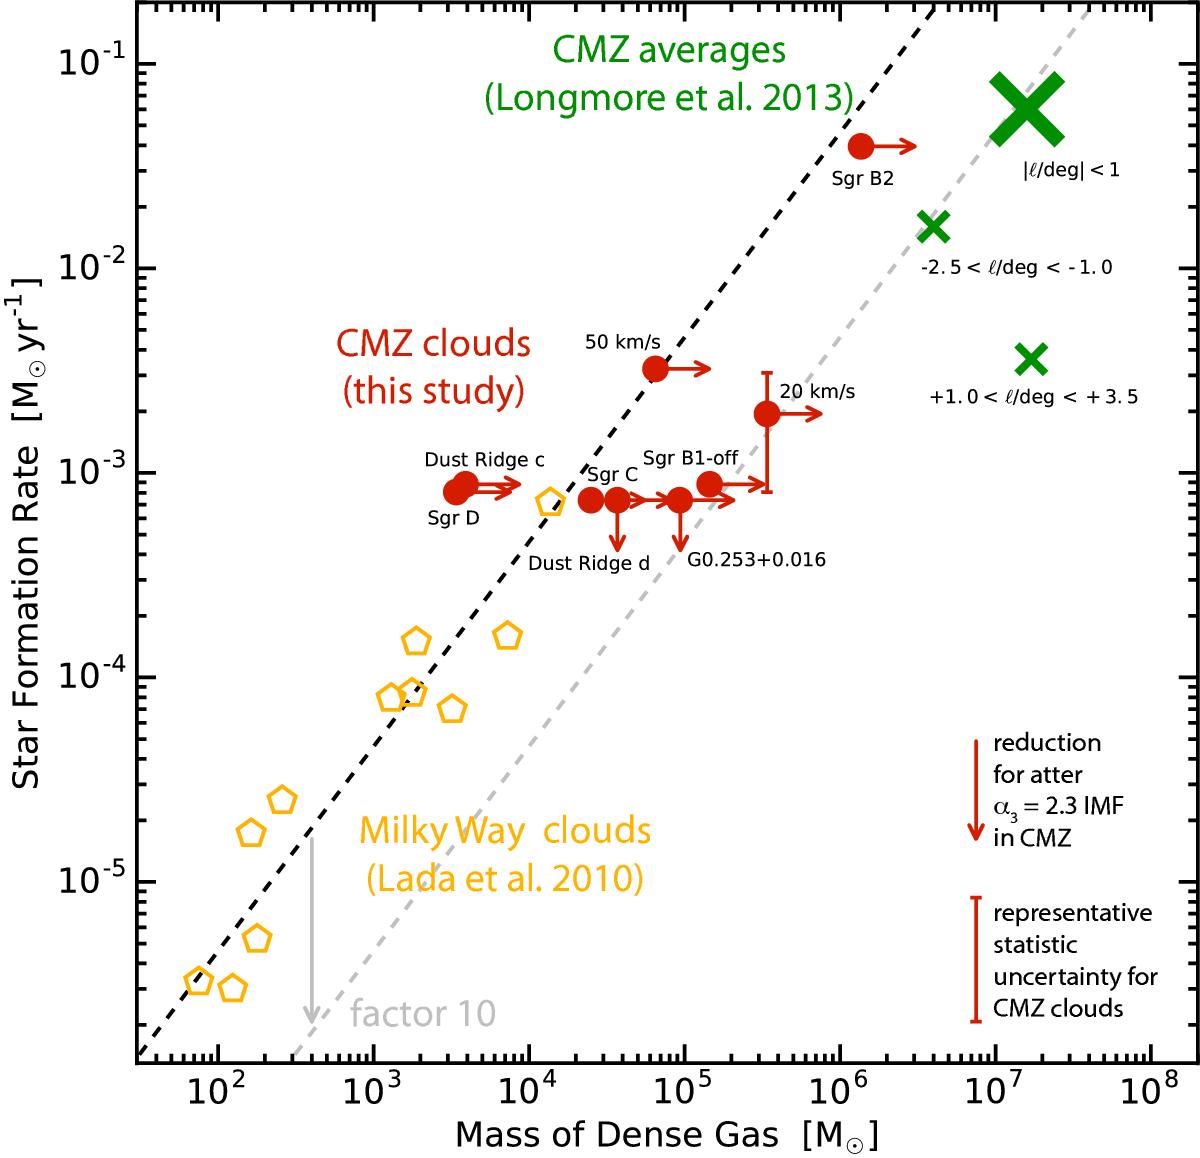
Observed star-formation rates vs. the mass of dense gas residing at visual extinctions AV > 7 mag. Yellow symbols give the properties of molecular clouds within about 500 pc from sun compiled by Lada et al. (2010). Green crosses plot data for several degree-sized regions in the CMZ from Longmore et al. (2013a), as indicated by small labels. The large green cross applies to the | ℓ | ≤ 1° region largely explored by this paper. The red bullets give masses and star-formation rates for individual CMZ clouds determined in this paper building on data for methanol masers and H ii regions. The red error bar in the lower right corner indicates the statistical uncertainty in SF rate that holds for the CMZ clouds containing few H ii regions or none. This excludes Sgr B2, for which much lower statistical uncertainties apply. The nearby red arrow indicates the reduction in SF rate for the same clouds with H ii regions if a flatter IMF is adopted. The black dashed line indicates a fit to the solar neighborhood data taken from Lada et al. (2010). The gray dashed line gives a relation with a star-formation rate lower by a factor 10.
Current usage metrics show cumulative count of Article Views (full-text article views including HTML views, PDF and ePub downloads, according to the available data) and Abstracts Views on Vision4Press platform.
Data correspond to usage on the plateform after 2015. The current usage metrics is available 48-96 hours after online publication and is updated daily on week days.
Initial download of the metrics may take a while.