Fig. 4
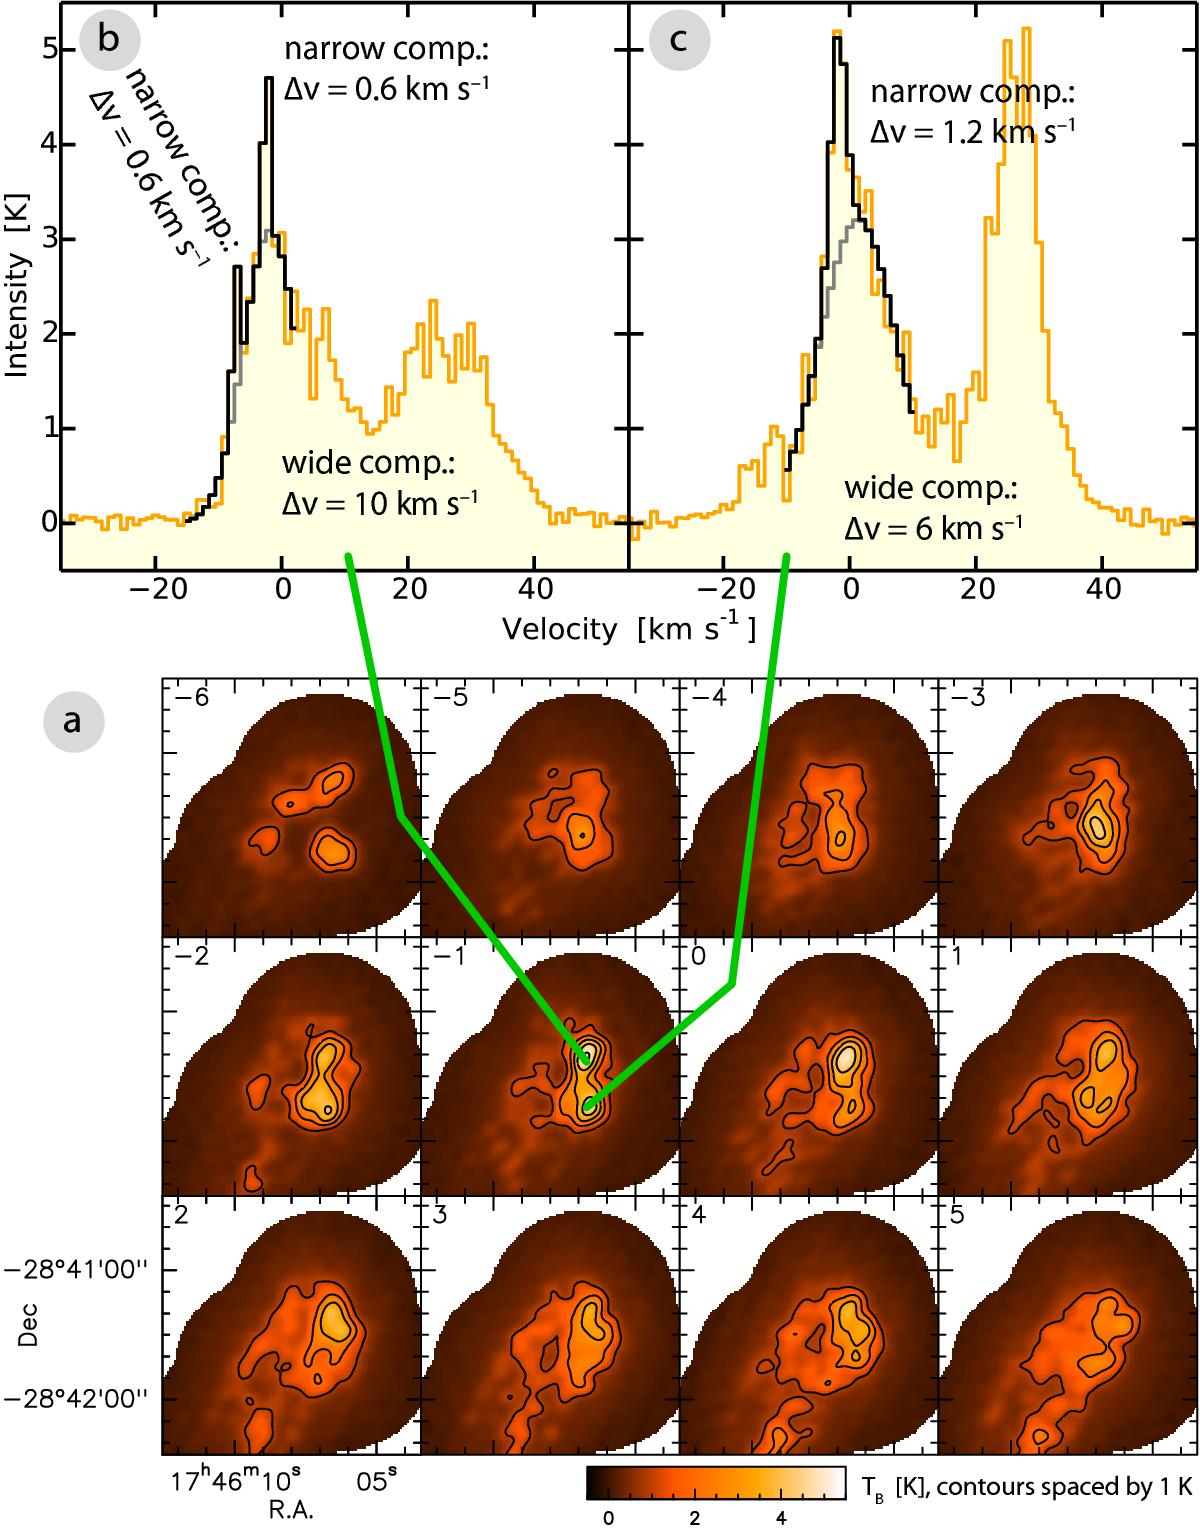
N2H+ (3–2) data for a sample region in the north of G0.253+0.016. Panel a) presents channel maps. The velocity in km s-1 is indicated in the upper left corner. Panels b) and c) show spectra extracted towards selected positions. Black lines in these plots depict multi-component Gaussian fits to selected velocity ranges of the spectra, where gray lines trace the structure of the widest component. For each component we indicate the full width at half maximum, Δv.
Current usage metrics show cumulative count of Article Views (full-text article views including HTML views, PDF and ePub downloads, according to the available data) and Abstracts Views on Vision4Press platform.
Data correspond to usage on the plateform after 2015. The current usage metrics is available 48-96 hours after online publication and is updated daily on week days.
Initial download of the metrics may take a while.