Fig. 2
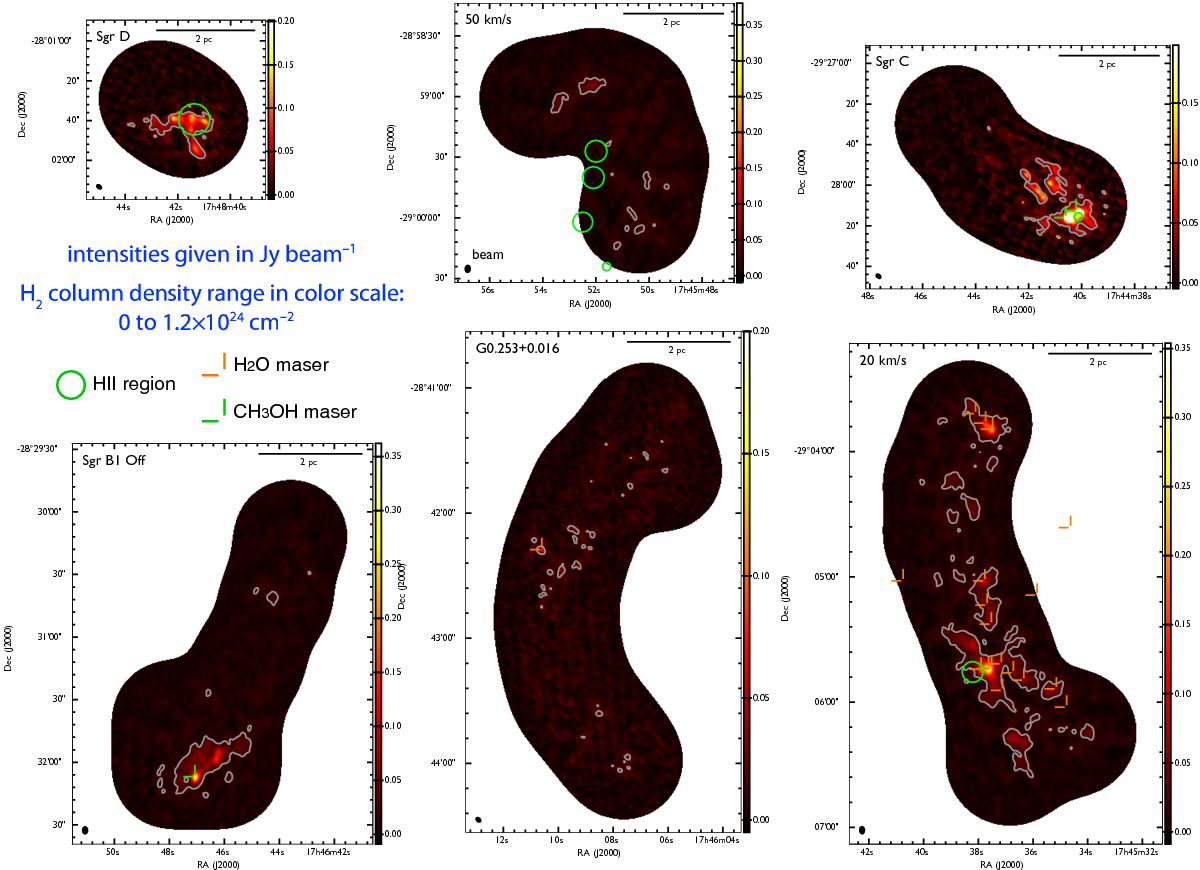
Maps of dust continuum emission produced from the SMA interferometer data alone. Intensities are multiplied by gain distributions that suppress noise at the map boundaries. Beam shapes and sizes are indicated in the lower left corner of each panel, while a scale bar in the top right corner indicates physical dimensions. Color bars labeled in units of Jy beam-1 give the intensity scale separately for every image. We note that the beam size varies between maps. We choose the color bar to represent a fixed H2 column density range of [ 0,1.2 ] × 1024 cm-2. In other words, images are represented in a manner that makes column densities directly comparable. A solid contour indicates the observed intensity exceeds the noise by a factor 5. Overlaid green circles, green crosses, and orange crosses indicate the locations of H ii regions, methanol masers, and water masers, respectively.
Current usage metrics show cumulative count of Article Views (full-text article views including HTML views, PDF and ePub downloads, according to the available data) and Abstracts Views on Vision4Press platform.
Data correspond to usage on the plateform after 2015. The current usage metrics is available 48-96 hours after online publication and is updated daily on week days.
Initial download of the metrics may take a while.