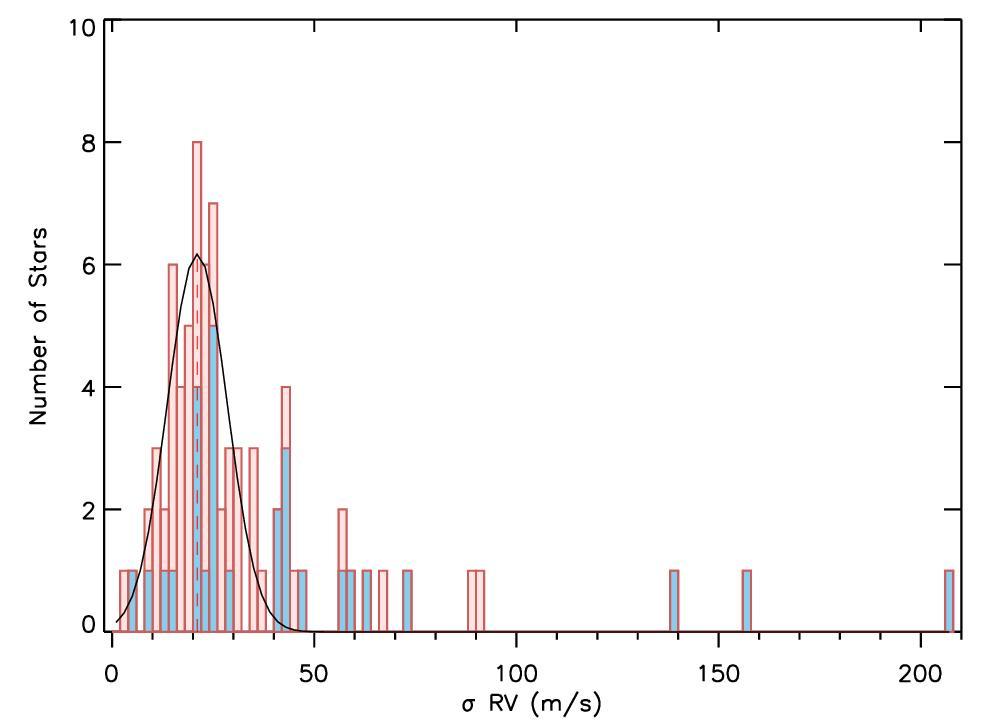
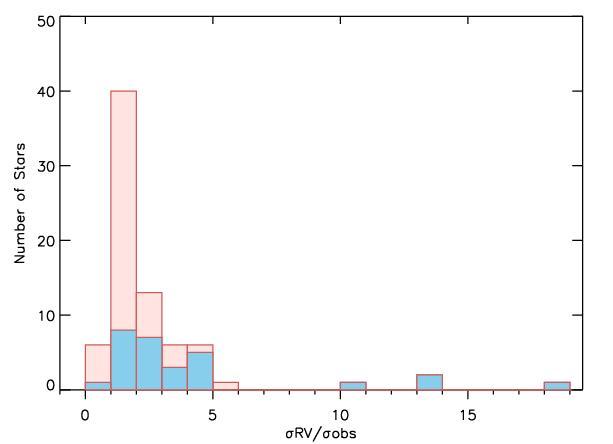
Fig. 2
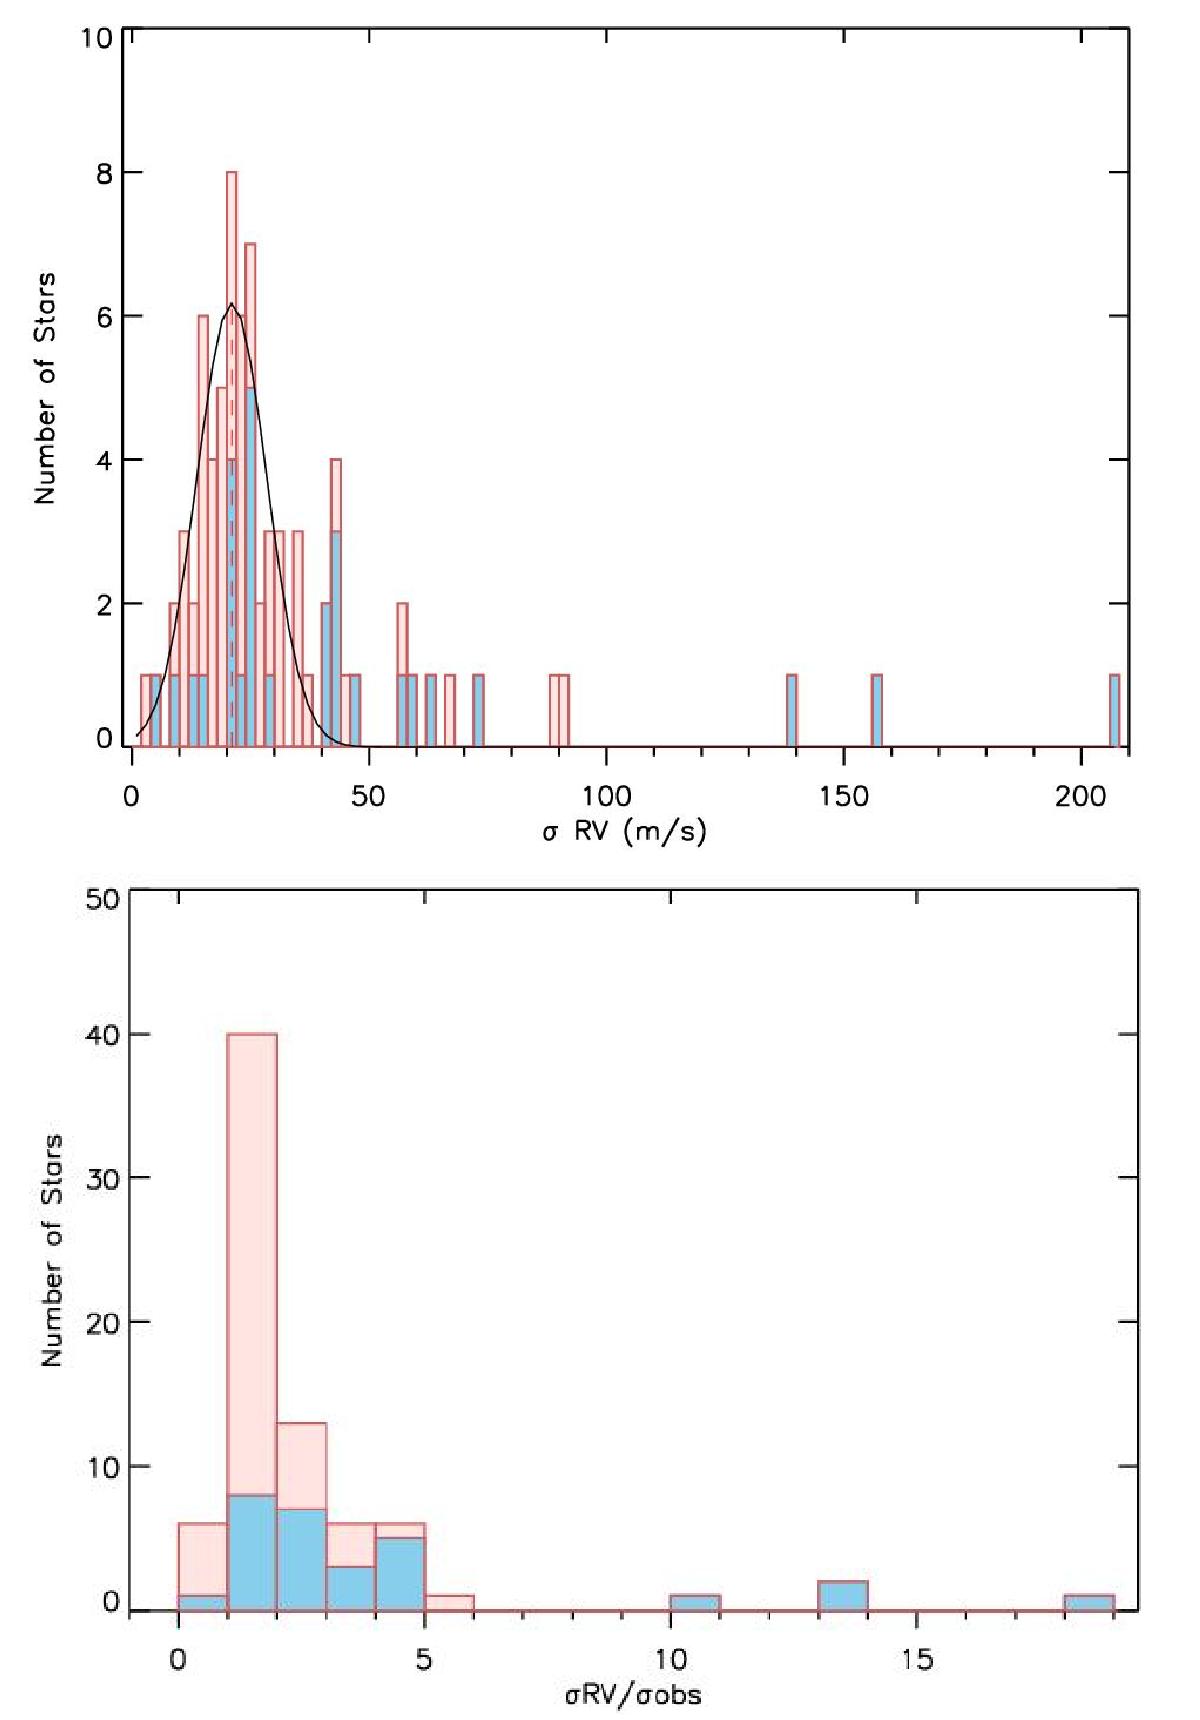
Top: histogram showing the observed velocity dispersions (σRV) for the MS stars (pink) and giants and turn-off stars (blue) of our sample. Binary candidates and stars with high RV trend have been excluded. The black line represents the Gaussian fit centered at ~21 m s-1 of width σ ~ 7 m s-1. Bottom: histogram showing the ratio of the RV dispersion (σRV) and the average measurements error (σobs). The symbols are the same as in the top panel.
Current usage metrics show cumulative count of Article Views (full-text article views including HTML views, PDF and ePub downloads, according to the available data) and Abstracts Views on Vision4Press platform.
Data correspond to usage on the plateform after 2015. The current usage metrics is available 48-96 hours after online publication and is updated daily on week days.
Initial download of the metrics may take a while.