Fig. 10
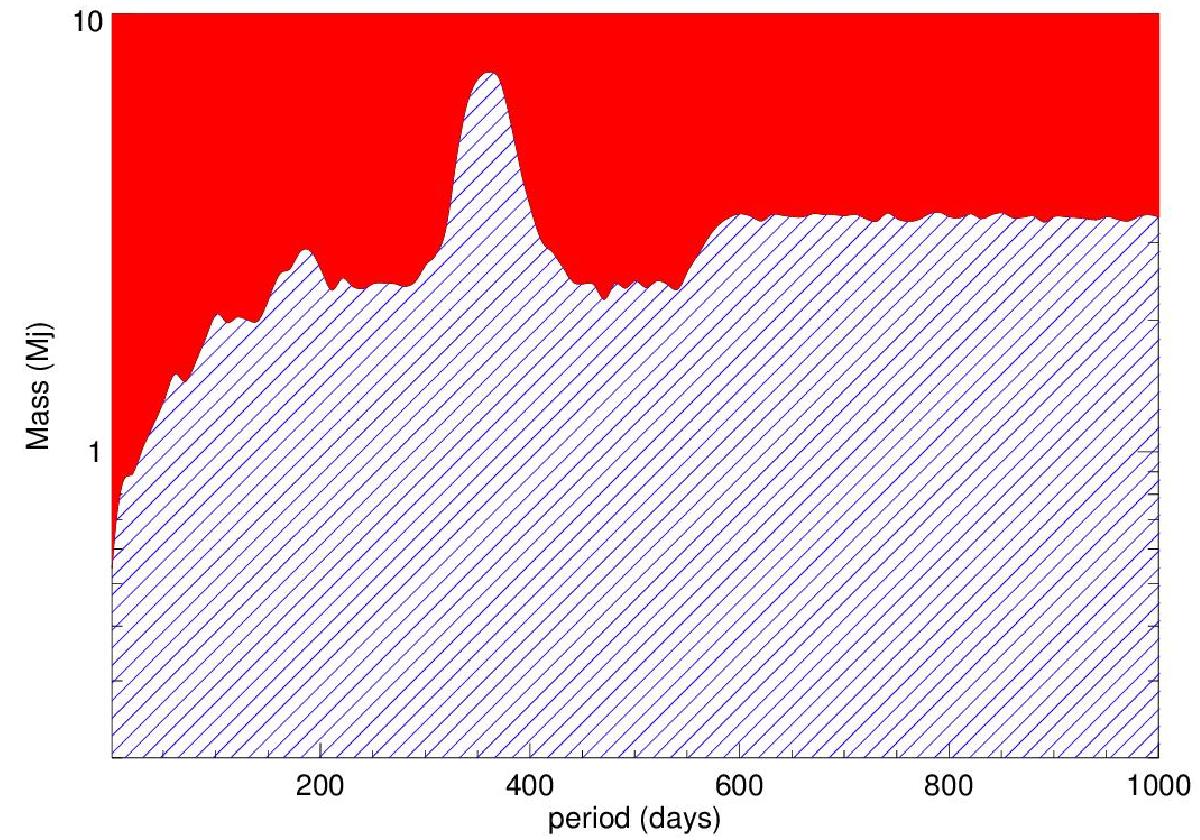
Planet detection regions for a star of the sample derived using the RV rms analysis. Red area: the rms of the simulated RV values is more than three times higher than the real measurement error, thus all potential planets can be detected. Blue ruled area: the rms of the simulated RV values is lower than three times the real measurement errors. Potential planets in this mass-period range cannot be detected with our observations.
Current usage metrics show cumulative count of Article Views (full-text article views including HTML views, PDF and ePub downloads, according to the available data) and Abstracts Views on Vision4Press platform.
Data correspond to usage on the plateform after 2015. The current usage metrics is available 48-96 hours after online publication and is updated daily on week days.
Initial download of the metrics may take a while.