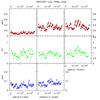
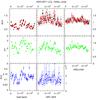
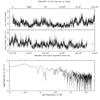
Fig. 2
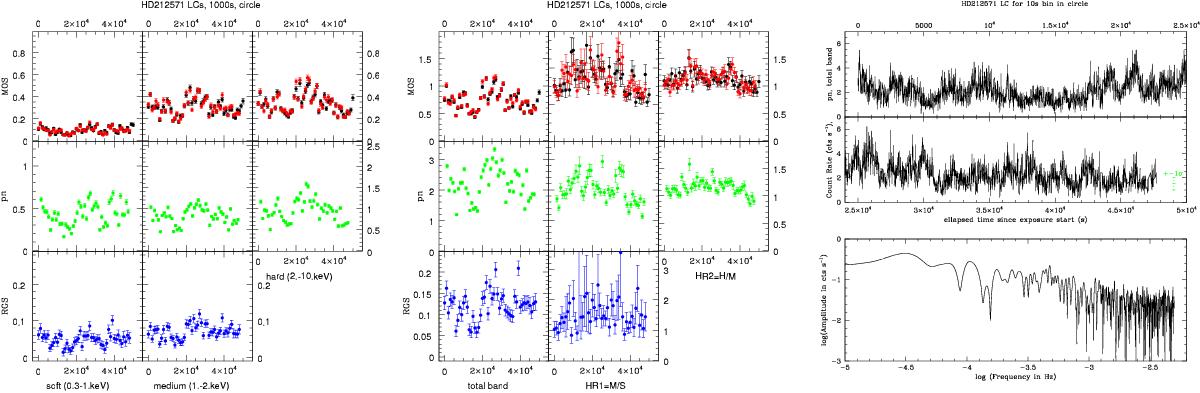
Left and middle: background-subtracted lightcurves, with a 1 ks bin and for different energy bands, recorded with the three EPIC cameras and with the RGS (MOS1 in black, MOS2 in red, pn in green, combination of both RGS and both orders in blue) extracted in a circular region around π Aqr. The EPIC data extracted in an annular source region (see Sect. 2) are similar, but noisier. Right: background-subtracted lightcurve with a 10 s bin recorded for pn, along with its Fourier periodogram (Heck et al. 1985). The green dotted line indicates the typical ± 1σ error around each data point. The short-term variations clearly are larger than this, demonstrating the presence of flares.
Current usage metrics show cumulative count of Article Views (full-text article views including HTML views, PDF and ePub downloads, according to the available data) and Abstracts Views on Vision4Press platform.
Data correspond to usage on the plateform after 2015. The current usage metrics is available 48-96 hours after online publication and is updated daily on week days.
Initial download of the metrics may take a while.