Fig. 1
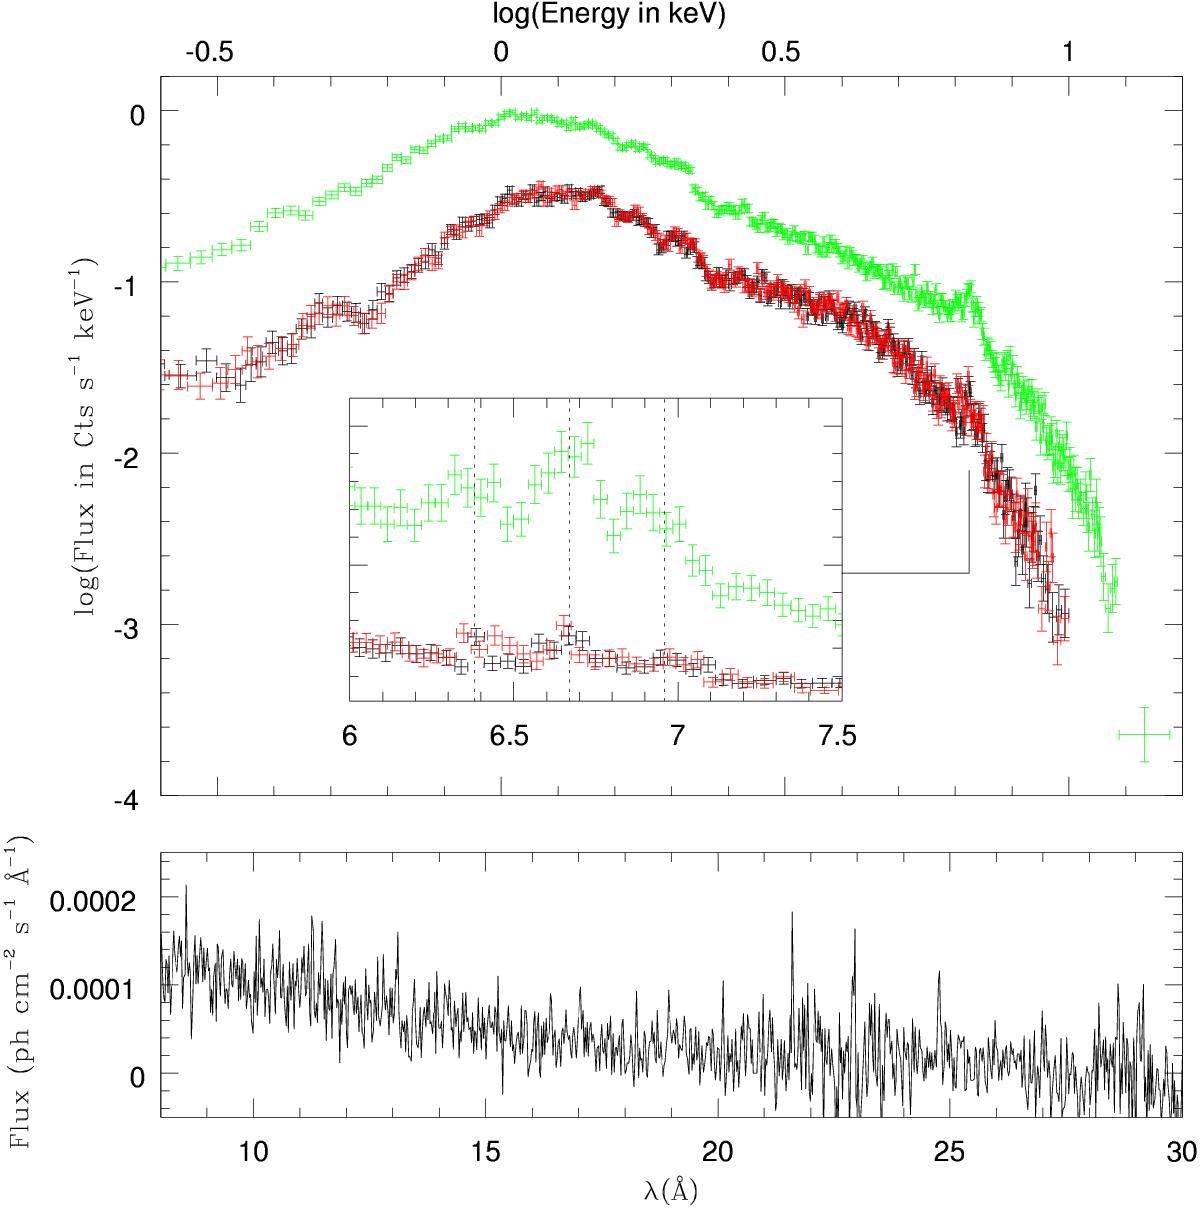
The three EPIC spectra (top, MOS1 in black, MOS2 in red, and pn in green) extracted in a circular region centered on π Aqr and the combined RGS spectrum (bottom). A close-up on the FeKα complex, with the positions of the three components shown by dotted lines, is included in the top panel. The EPIC data extracted in an annular source region (see Sect. 2) are similar, but noisier.
Current usage metrics show cumulative count of Article Views (full-text article views including HTML views, PDF and ePub downloads, according to the available data) and Abstracts Views on Vision4Press platform.
Data correspond to usage on the plateform after 2015. The current usage metrics is available 48-96 hours after online publication and is updated daily on week days.
Initial download of the metrics may take a while.